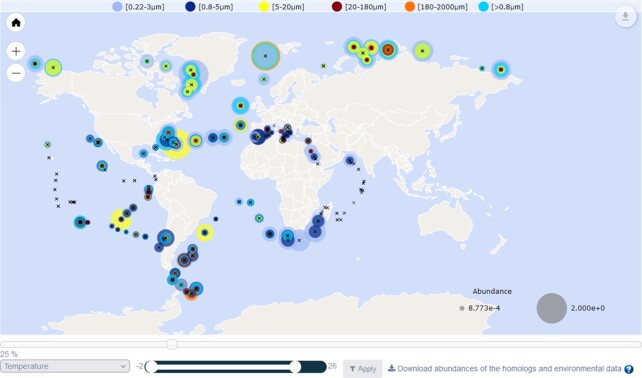
Figure 5.
Interactive world map. The geographic distribution of homologues abundances are represented on a map and an environmental parameter can be selected from the drop-down list (e.g. temperature). Using the associated slider (e.g. 4–12°C) and the ‘Apply’ button, only the sequence subset corresponding to the selected range are displayed on the map. The abundance files and environmental variables corresponding to the subset selection can be downloaded.

