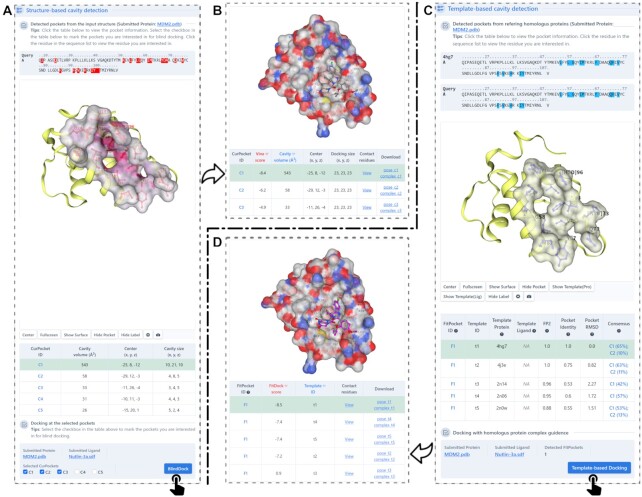
Figure 3.
Output interfaces of cavity detection. (A) The cavities detected by analyzing the concave regions on the solvent accessible surface of the query protein. (B) The docking results after clicking the button of ‘BlindDock’. (C) The cavities detected based on homologus templates. (D) The docking results after clicking the button of ‘Template-based Docking’.

