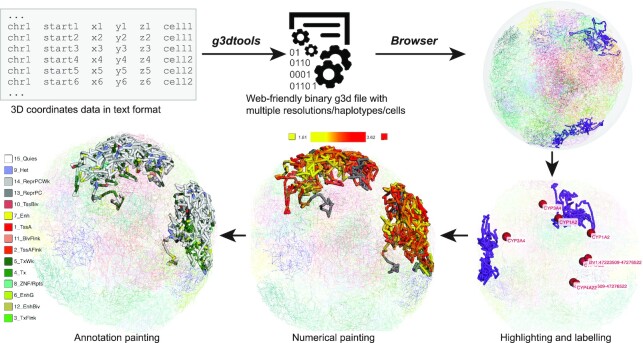
Figure 3.
3D viewer. An overview of how 3D data is displayed in the Browser. 3D coordinates in text format are converted to the binary g3d data using g3dtools, then the file is submitted to the browser for visualization. The 3D viewer can highlight current browser regions or specific genes. Users can also use numerical and annotation data to decorate the 3D structure.

