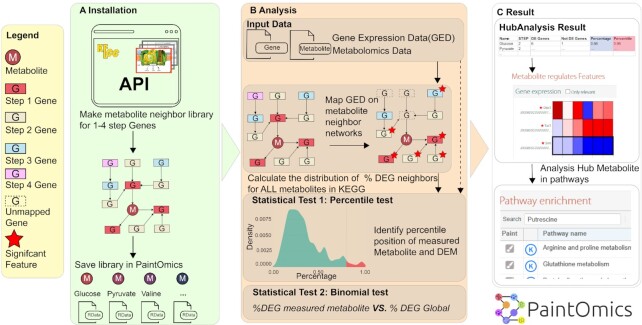
Figure 1.
New metabolomics analysis in PaintOmics 4. (A) Neighbouring genes for each metabolite at 1 to 4 network steps are identified. (B) The percentile and binomial tests are used to identify metabolites with a high density of DEGs in their proximal network. (C) Metabolites and Genes identified in the analysis are shown as heatmaps with links to associated pathways. DEM: differentially expressed metabolite; DEG: differentially expressed gene.

