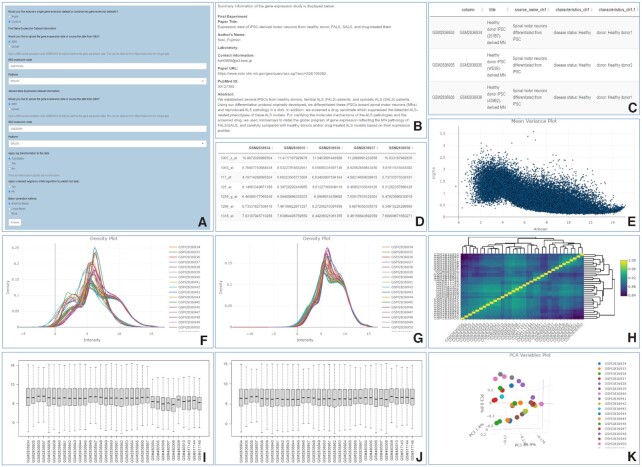
Figure 2.
GEOexplorer data collection, harmonisation, and transformation settings, study and experiment information, and EDA outputs. (A) GEOexplorer data collection, harmonisation, and transformation settings. (B) Experiment information. (C) Experimental conditions information. (D) Gene expression dataset. (E) Mean-variance plot. (F) Expression density plot pre-batch correction. (G) Expression density plot post-empirical Bayes batch correction. (H) Heatmap plot. (I) Box-and-whisper plot pre-batch correction. (J) Box-and-whisper plot post-empirical Bayes batch correction. (K) 3D PCA variables.

