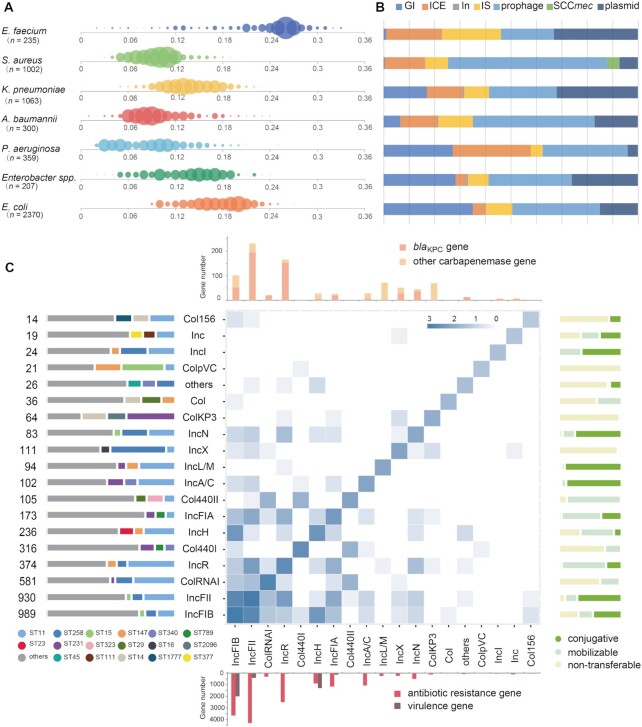
Figure 2.
VRprofile2-estimated size of the mobilome borne by individual strains of the ESKAPEE group. (A) Bubble chart of the estimated mobilome size. The complete genome sequences of 5,536 ESKAPEE bacteria were retrieved from GenBank. The abscissa axis represents the mV value of individual strains, calculated by dividing the mobilome size by its whole genome size. The bubble size represents the magnitude of the individual strains under analysis. (B) The distribution of MGE types includes the GI, ICE, integron (In), IS, prophage, SCCmec and plasmid. (C) The relationship between the strains (n= 1063), plasmids (n= 3525), and plasmid-carrying ARGs (n= 8924) of Klebsiella pneumoniae. The heat map presents the profile of the plasmids belonging to different incompatibility groups (Inc). The number (log value) of all the identified Inc groups in the single- or multiple-replicon plasmids (Supplementary Table S3) is plotted alongside the map diagonal. The number of the Inc pairs in the individual multiple-replicon plasmids is depicted in the cell. The left bar chart indicates the plasmid number and the proportion in different sequence typing (MLST) strains. For the plasmid containing two replicon regions, the plasmid number of each Inc group was counted separately. The right bar chart denotes the plasmid transferability. The top bar chart presents the number of blaKPC and other carbapenemase genes (see Supplementary Figure S7 for details). The down bar chart shows the number of ARGs and virulence genes.

