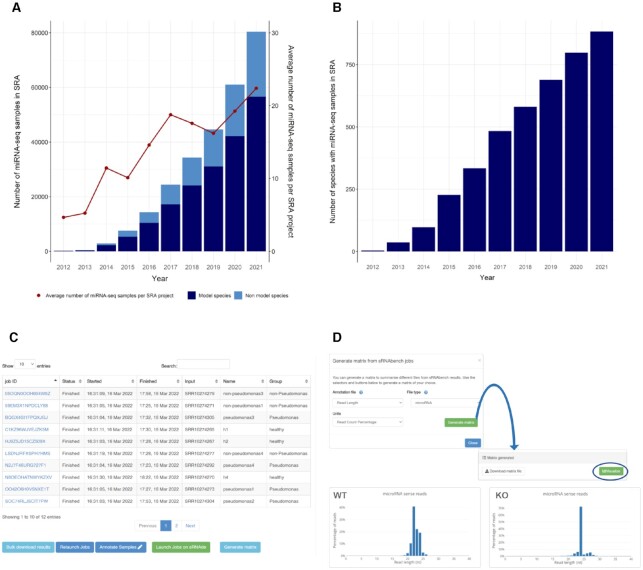
Figure 1.
Evolution of miRNA-seq data hosted on SRA and consequent improvements in sRNAbench. (A) Accumulated number of samples in SRA per year and the increasing tendency of samples per project. (B) Number of species with publicly available miRNA-seq data on SRA. Both graphics have been generated after querying the database (https://www.ncbi.nlm.nih.gov/sra/) with ‘Library selection’ field set to miRNA-seq. (C) New sRNAbench status page that allows for on-the-go annotation and direct launching of differential expression jobs. (D) New helper tool that can summarize and visualize statistics and count matrix. The microRNA read length distributions were obtained for two parental cell lines (WT; SRR3174960, SRR3174961) and two DICER KO cell lines (KO: SRR3174967,SRR3174968) showing clear differences between these two conditions.

