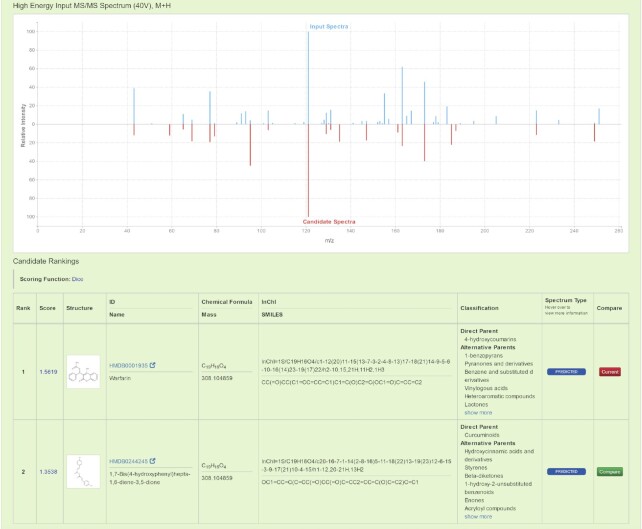
Figure 2.
An example of the output from a regular Compound Identification query using the experimentally acquired product ion MS/MS spectrum of Warfarin against the in silico CFM-ID spectral databases. The top half of the figure illustrates the mirrored MS/MS spectral plot between the experimental MS/MS spectrum (blue peaks), and the highest ranked candidate in silico MS/MS spectrum (red peaks). A table with the detailed candidate scores, structures and spectral links is presented on the bottom half of the page.

