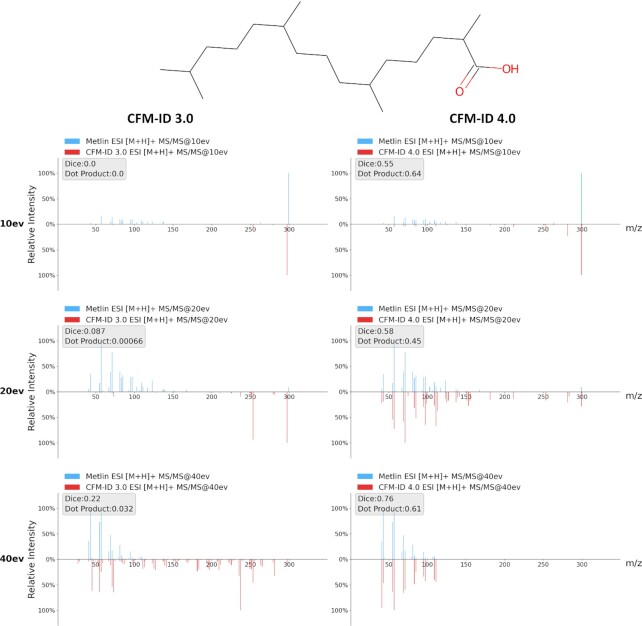
Figure 3.
A comparison of the quality of CFM-ID 4.0 predicted MS/MS spectra versus CFM-ID 3.0 predicted MS/MS spectra. This figure compares the predicted ESI-MS/MS [M-H]- spectra of pristanic acid as predicted by CFM-ID 3.0 (on the left) and CFM-ID 4.0 (on the right) at different collision energies. The actual experimental MS/MS spectra for this compound are displayed on the top (blue peaks) while the predicted in-silico MS/MS spectra (red peaks) are displayed on the bottom of the mirror plots.

