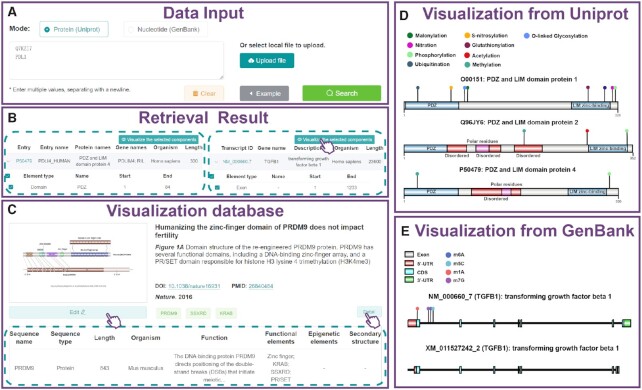
Figure 3.
A snapshot of the batch visualization module in IBS 2.0. (A) The data input panel. (B) Retrieval results from the UniProt (left) and RefSeq (right) databases. (C) The main interface of the resource platform. (D) Visualization of the PDZ and LIM domain protein families using the batch visualization module. (E) Visualization of the TGFB1 transcript isoforms using the batch visualization module.

