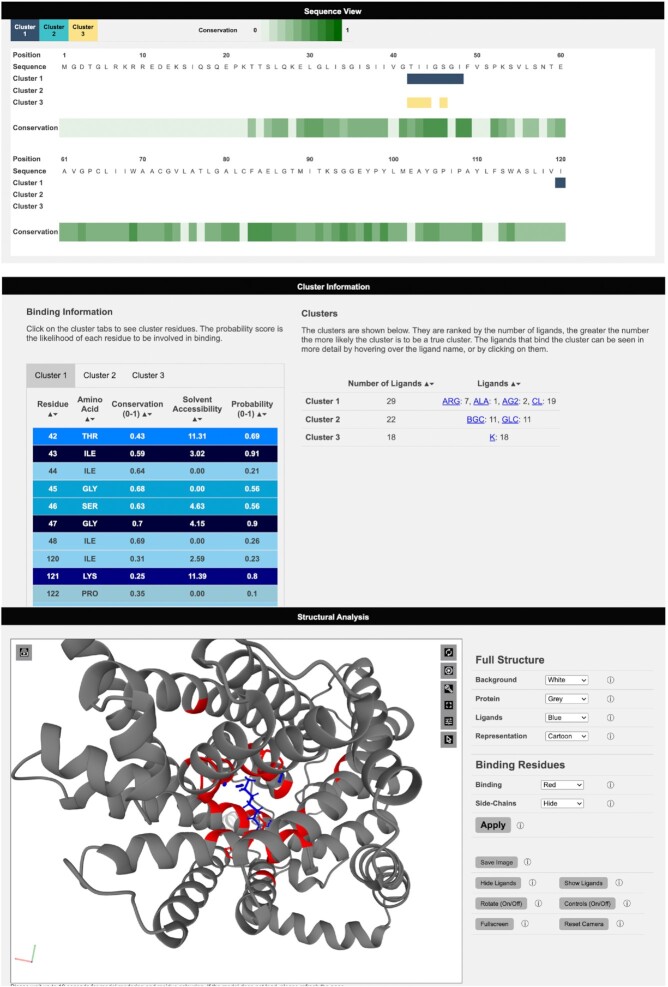
Figure 3.
Viewing results on the 3DLigandSite web server. Results are presented in three main sections: a sequence view, which maps sequence conservation and the different clusters identified onto the protein sequence. Second, details of the clusters, including the number of ligands and type of ligand, are displayed as well as a table listing the residues predicted to form the binding site for each cluster. Finally, the structural analysis section includes a Mol* molecular viewer to visualize the protein, the predicted binding site and the clusters used to make the predictions. A separate control panel (on the right) enables users to easily modify the display.

