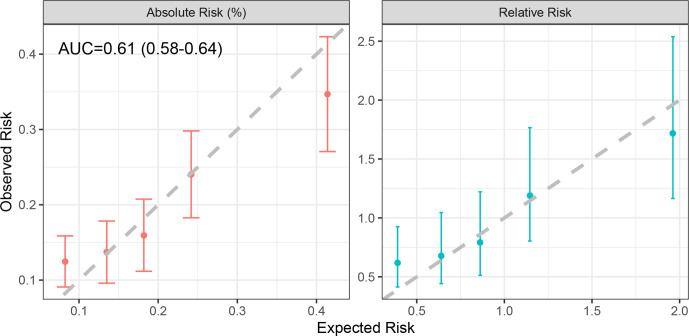
Figure 4.
Calibration of the absolute and relative predicted 5-year EOC risks, showing the observed and expected risks by quintile. The bars show the 95% CIs for the observed risks. Relative risks were calculated relative to the overall mean of observed and predicted risks. AUC, area under the receiver operating characteristic curve.

