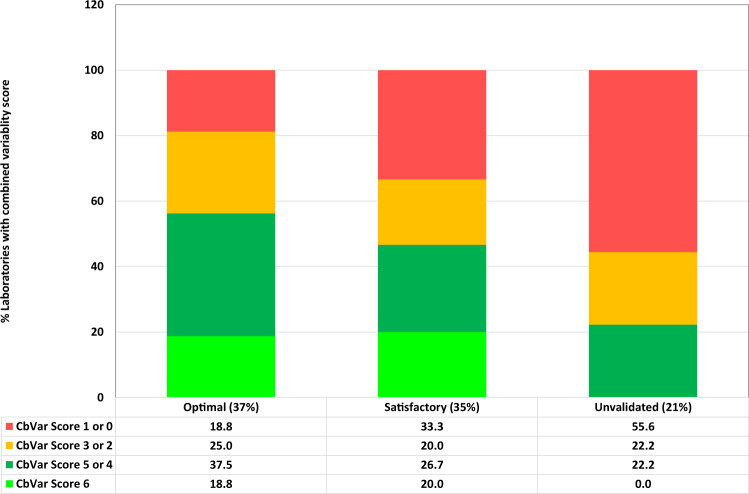
Fig. 4. Use of IQC material to assess how CFs correlate with assay variability.
CVs for BCR::ABL1IS results from high and low level internal quality control material were used to assess how assay variability might correlate with CF status (optimal, 37% of laboratories who tested the internal quality control material; satisfactory, 35% of laboratories; unvalidated, 21% of laboratories). Combined variability scores for the high and low standards were assigned using the following criteria: 3 points: CV < 1st quartile, 2 points: CV between 1st quartile and median, 1 point: CV between median and 3rd quartile. 0 points: CV > 3rd quartile. The overall variability score (CbVar) was defined as the sum of the scores for the high and low level standards. The bar charts show the % of laboratories per CF status that had a combined variability scores of 6 (bright green). 4 or 5 (green), 2 or 3 (amber) or 1/0 (red).

