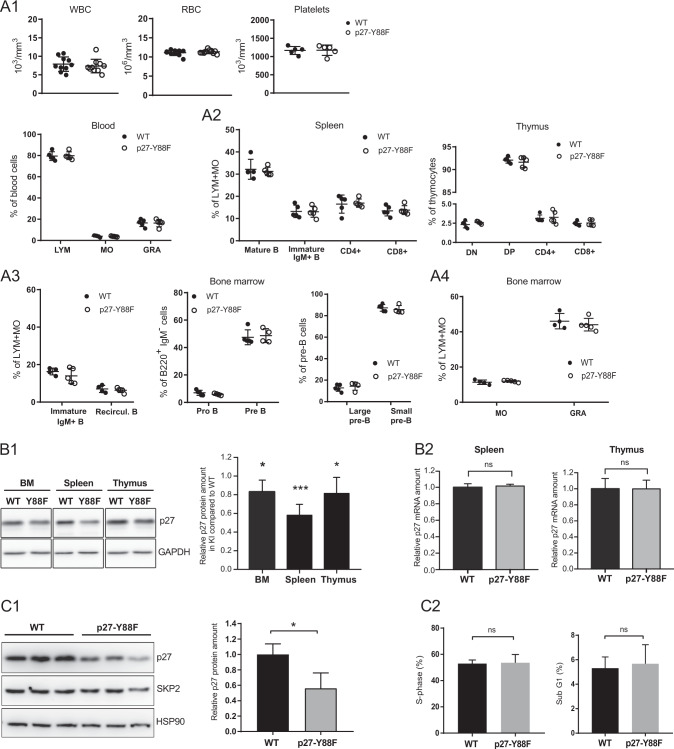
Fig. 2. p27 levels are decreased in hematopoietic cells of p27-Y88F mice whereas hematopoietic cell populations and early B-cell development remain unchanged.
A Characterization of hematopoietic populations. A1 Analysis of white blood cell count (WBC), red blood cell count (RBC), platelet counts (Platelets, upper panels) and lymphocytes (LYM), monocytes (MO) and granulocytes (GRA) (lower panel) with the ABC hemocytometer (n = 10 per group for WBC and RBC, n = 5 per group for platelets, LYM, MO and GRA). A2 Flow cytometry analysis of T and B-cell populations in the spleen (left panel). Frequencies of mature B cells (IgD+ IgM+), immature IgM+ B cells (IgM+ IgDlow) CD4+ T cells (CD3+CD4+CD8−) and CD8+ T cells (CD3+CD8+CD4−) of wild type and p27-Y88F mice are represented. Flow cytometry analysis of thymocyte subsets in the thymus (right panel). Double negative thymocytes (DN) (CD4−CD8−), double positive thymocytes (DP) (CD4+CD8+), CD4+ T cells (CD8−CD4+) and CD8+ T cells (CD8+CD4−) of wild type and p27-Y88F mice are depicted. (n = 5 per group); A3 Flow cytometry analysis of bone marrow subsets in wild type and p27-Y88F mice (n = 5 per group). Frequencies of individual populations during early B-cell development have been analyzed as indicated. Left panel shows immature IgM+ B cells (B220lowIgM+) and recirculating B cells (B220highIgM+). In the central panel pro-B cells (B220+IgM−CD25−c-kit+) and pre-B cells (B220+IgM−CD25+c-kit−) and in the right panel discrimination of the two pre-B subpopulations large pre-B and small pre-B cells by FS and SSC is represented. A4 Frequencies of monocytes (MO) (CD115+) and granulocytes (GRA) (CD115−SSC+) in the bone marrow are displayed. Data are represented as mean ± SD. No significant difference was detected between 10 weeks old wild type and knock in mice. B Analysis of p27 protein and mRNA levels in haematopoietic organs of 10 weeks old wild type and p27-Y88F mice. Littermate pairs stem from three different breedings (n = 5 per genotype). B1 Representative western blots of bone marrow (BM), spleen and thymus. Protein levels of p27 and GAPDH as loading control are represented. The right panel shows quantification of p27 protein normalized to GAPDH in p27-Y88F mice. p27 levels from wild type tissues have been set to 1. One sample t-test was used for statistical analysis. B2 qPCR analysis of p27 mRNA reveals no significant difference between splenocytes (left panel) and thymocytes (right panel) from wild type and p27-Y88F mice. C Immunoblot analysis of progenitor B-cell enriched cell cultures. Bone marrow cells were isolated from wild type and p27-Y88F mice and cultivated in B-cell culture medium containing 10 ng/ml rhIL7 for 7 days. n = 3 mice per group; C1 Protein levels of p27, SKP2 and HSP90 as loading control are represented. Right panel shows quantification of p27 protein normalized to HSP90. C2 Bar graphs represent percentage of wild type and p27-Y88F cells in S phase (left panel) and sub-G1 phase (right panel) analyzed by flow cytometry. Bar graphs represent mean ± SD. (*p < 0.05, ***p < 0.001).

