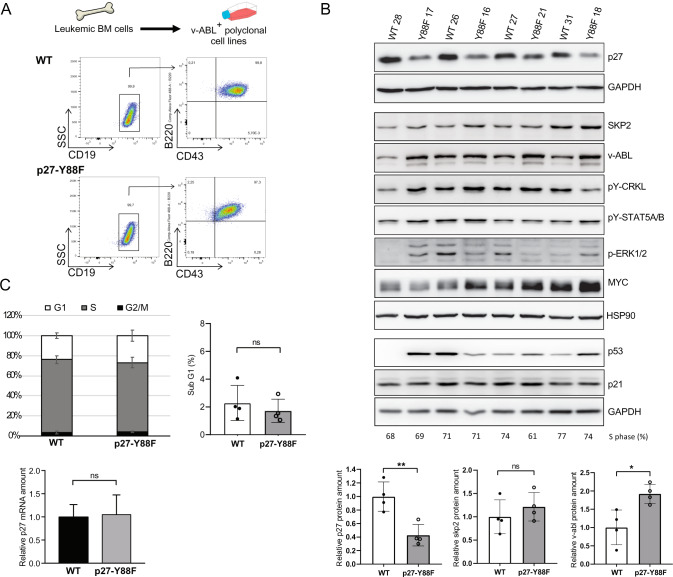
Fig. 5. p27 protein levels are decreased in v-ABL+ p27-Y88F cell lines derived from leukemic mice.
A Scheme of the generation of polyclonal v-ABL+ cell lines (upper panel) and representative FACS plots of B-cell marker staining (lower panels). Live cell population of v-ABL+ wild type and p27-Y88F cell lines were gated for CD19+ cells followed by B220 and CD43 as indicated by arrows. B Immunoblot analysis of wild type and p27-Y88F v-ABL+ cell lines generated from leukemic bone marrow cells shows protein levels of p27, SKP2, v-ABL, pY-CRKL, pY-STAT5A/B, p-ERK1/2, MYC, p53, p21 and GAPDH and HSP90 as loading controls. Densitometric analyses of p27 normalized to GAPDH, SKP2 and v-ABL levels normalized to HSP90 are shown below. Protein levels in wild type cells were set to 1. C Percentages of v-ABL+ wild type and p27-Y88F cell lines in G1, S and G2/M phase (left panel) and sub-G1 phase (right panel) as determined by flow cytometry. Lower panel displays p27 mRNA levels determined by qPCR in wild type and p27-Y88F v-ABL+ cell lines. n = 4 per genotype. Cell lines correspond to those used in B. One representative experiment out of three is shown. Data represent mean ± SD. (*p < 0.05, **p < 0.01, ***p < 0.001).

