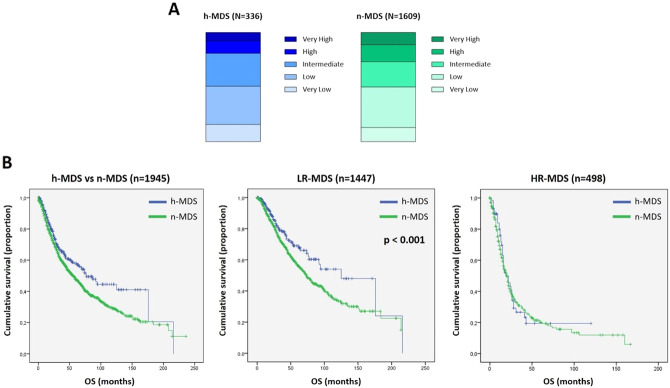
Fig. 1. Risk stratification and OS of h-MDS compared to n-MDS.
1-A Patients stratification into IPSS-R risk categories. H-MDS are represented in shades of blue (with light blue stating for very low risk and dark blue stating for very high risk categories); n-MDS are represented in shades of green (with light green stating for very low risk and dark green stating for very high risk categories). In detail, h-MDS were distributed as follows: 15.5% Very Low, 35.1% Low, 30.1% Intermediate, 11.3% High, 8% Very High. N-MDS patients were classified as: 12.8% Very Low, 37.2% Low, 23.1% intermediate, 15.5% High, 11.4% Very High. 1-B Kaplan–Meier curves showing OS in the entire MDS cohort (left panel), LR-MDS (central panel) and HR-MDS (right panel), comparing h-MDS (in blue) vs n-MDS (in green). Vertical lines denote censored patients. Median OS is significantly higher in LR h-MDS as compared to LR n-MDS (central panel, 125 vs 74 months, p < 0.001). Note: h-MDS, hypocellular myelodysplastic syndromes; HR high-risk; LR low-risk; n-MDS normo-/hypercellular myelodysplastic syndromes; OS overall survival.

