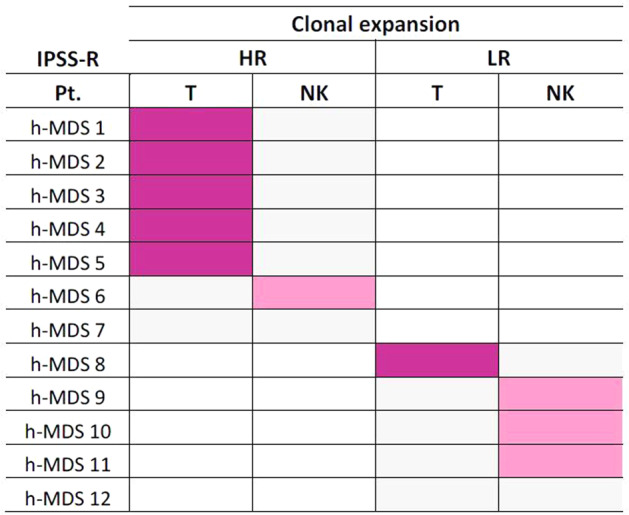
Fig. 2. Distribution of T cell (purple) and NK cell (pink) clonal populations in h-MDS patients (n = 12) according to the IPSS-R stratifications.

Clonality of T and NK cell expansions was assessed in a cohort of 12 h-MDS patients enrolled within the FISiM-hMDS14 sub-study and data were evaluated according to patients IPSS-R. T cell clonal expansions are represented in purple, while NK cell clonal expansions are represented in pink. A peculiar associations of T-cell clones with HR h-MDS and of clonal NK cell expansions with LR h-MDS was observed. No contemporary detection of clonal T and NK cell populations was found. In two patient (#7 and #12) any clonality was detected. Note: h-MDS, hypocellular myelodysplastic syndromes; HR higher risk; IPSS-R Revised International Prognostic Scoring System; LR lower risk; NK natural killer.
