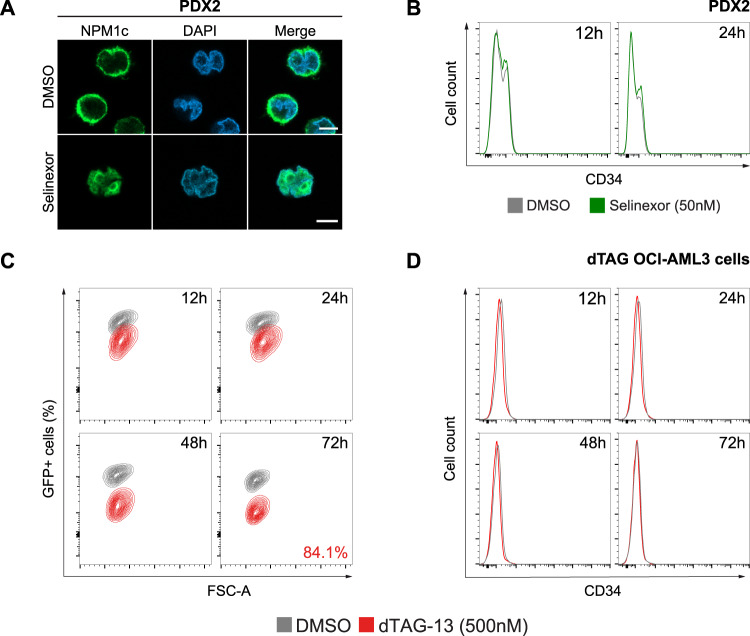
Fig. 1. Nuclear relocalization or selective degradation of mutant NPM1 does not alter CD34 expression.
A. Representative fluorescence microscopy images of PDX2 cells treated for 12 h with DMSO (control) or selinexor 50 nM. Cells were labeled with anti-NPM1 mutant antibody (NPM1c, green). Cell nuclei were stained with DAPI (blue). 63x magnification. Scale bar, 5 μm. B Representative histogram plots for CD34 expression analyzed by flow cytometry at 12 and 24 h in PDX2 cells treated with either DMSO (control, grey) or selinexor 50 nM (green). C Flow cytometry contour plots showing the percentage of GFP+ cells at 12, 24, 48 and 72 h in dTAG OCI-AML3 cells treated with DMSO (control, grey) or dTAG-13 500 nM (red). The degradation rate of mutant NPM1 at 72 h is shown. D Overlaid histogram plots representing CD34 expression analyzed by flow cytometry at 12, 24, 48 and 72 h in dTAG OCI-AML3 cells treated with either DMSO (control, grey) or dTAG-13 500 nM (red).

