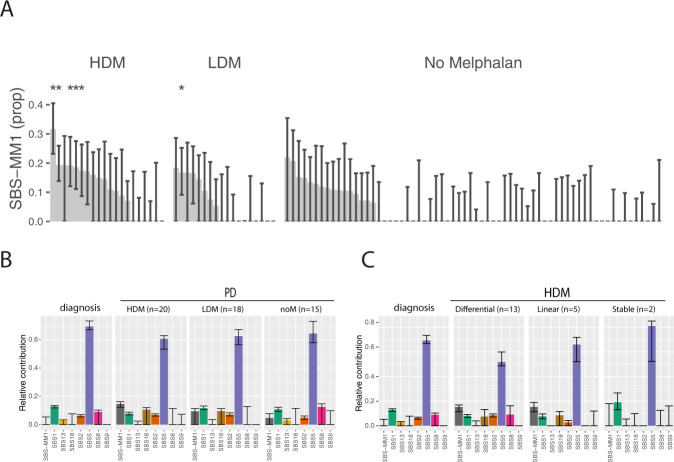
Fig. 2. Mutational signatures after treatment with Melphalan.
A Estimated SBS-MM1 contribution with 95% CI for individual patients. Only patients exposed to melphalan showed evidence of significant SBS-MM1 contribution. *statistically significant transcriptional strand bias in the typical pattern for SBS-MM1: C > T mutations in the trinucleotide contexts CCA, GCA, GCC, GCG, and GCT. B Mutation signature patterns at diagnosis versus PD divided into HDM (high dose melphalan), LDM (low dose melphalan) or noM (no melphalan) groups. C Mutational signature analysis of diagnosis samples and samples receiving HDM based on their evolutional pattern.

