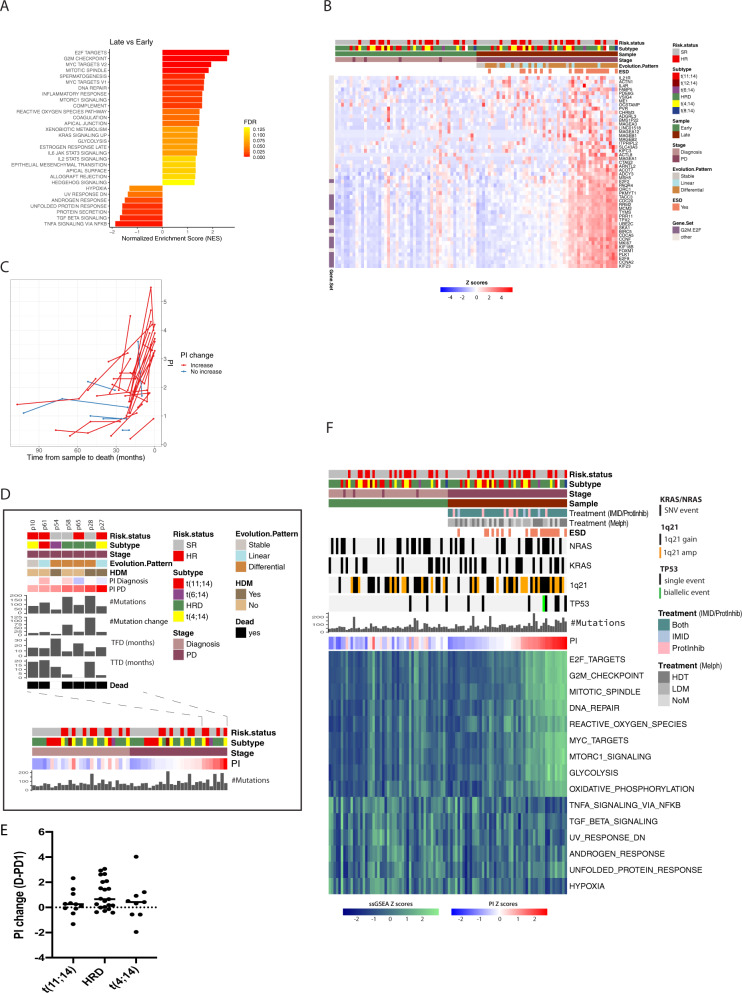
Fig. 3. Increased expression of genes involved in proliferative and metabolic pathways at progression.
A GSEA analysis using hallmark gene sets showed that 23 pathways were upregulated and 7 downregulated (FDR q-value<0.2, NES > 1.3) at late stage (latest available PD sample) versus early (1st sample). The top upregulated pathways were E2F targets and G2M checkpoint involved in cell division and cell cycle. FDR: False discovery rate. B Heatmap showing the top 50 upregulated genes and their expression levels (log2(TPM + 1), z scored) in early and late samples. C The figure shows the evolvement in proliferative index (PI) between early and late samples in deceased patients. There was significant increase in PI in end-stage disease. D The figure shows diagnosis-1st PD paired samples, and shows that patients with high PI at 1st PD have different cytogenetic backgrounds. Mutation load and increase from diagnosis, time from diagnosis (TFD), and time to death/last control (TTD) are shown for patients with high PI at 1st PD. E There was no significant difference in PI increase in diagnosis-first available PD sample between cytogenetic subgroups. This did not change when dividing the HRD group into cyclinD1 or cyclinD2 expressers (Fig. S6). CCND2, CCND3 and MAFs were not included due to few samples. F Heatmap for selected pathways showing ssGSEA for early-late pairs. Information on mutation load and presence of the most frequently enriched/acquired genomic aberrations at PD (KRAS, NRAS, amp1q21, and TP53) as well as intervening treatment received between the two BM sample timepoints are shown. In heatmaps patients are sorted horizontally by increasing PI of the late samples (right half) and the same patient order is used for the early samples (left half). SR standard risk according to ISS/R-ISS, HR High risk, ESD End-stage disease (<12 months from death). Cytogenetic subgroups; t(11;14)/CCND1, t(12;14)/ CCND2, t(6;14)/CCND3, t(4;14)/WHSC1(NSD2/MMSET), t(8;14)/MAFA are shown (Table S12). IMID Immunomodulatory drug, ProtInhib Proteasome inhibitor.

