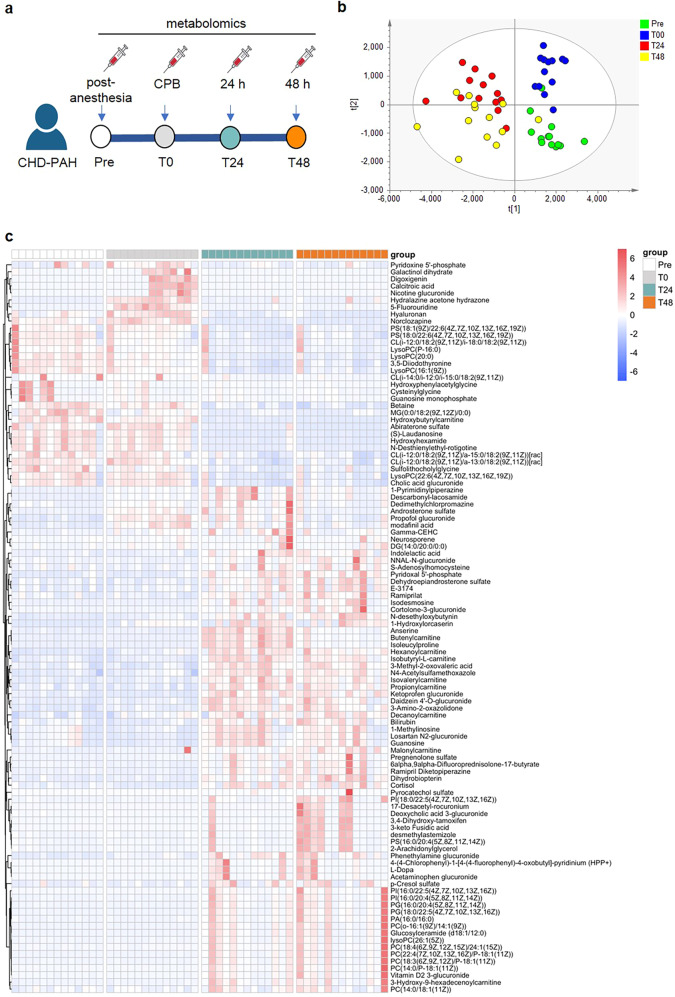
Fig. 1. Overall comparative analysis of the metabolic profiling in 13 CHD–PAH patients during the perioperative stage.
a Schematic of the study design. Blood was drawn at four different time points (before cardiopulmonary bypass (CPB) after anesthesia (Pre), immediately after cardiopulmonary bypass (T0), 24 h (T24), and 48 h (T48) after surgery). Plasma was collected for metabolomics. b Score plots of PLS-DA analysis on the plasma metabolic profiles at four timepoints (green for Pre, blue for T0, red for T24, and yellow for T48). c Heatmap showing the distinguished metabolites (VIP > 1) with fold change of both T48 vs. Pre and T24 vs. Pre >2 or <0.5 in plasma from 13 CHD–PAH patients at the indicated time points. CPB cardiopulmonary bypass.

