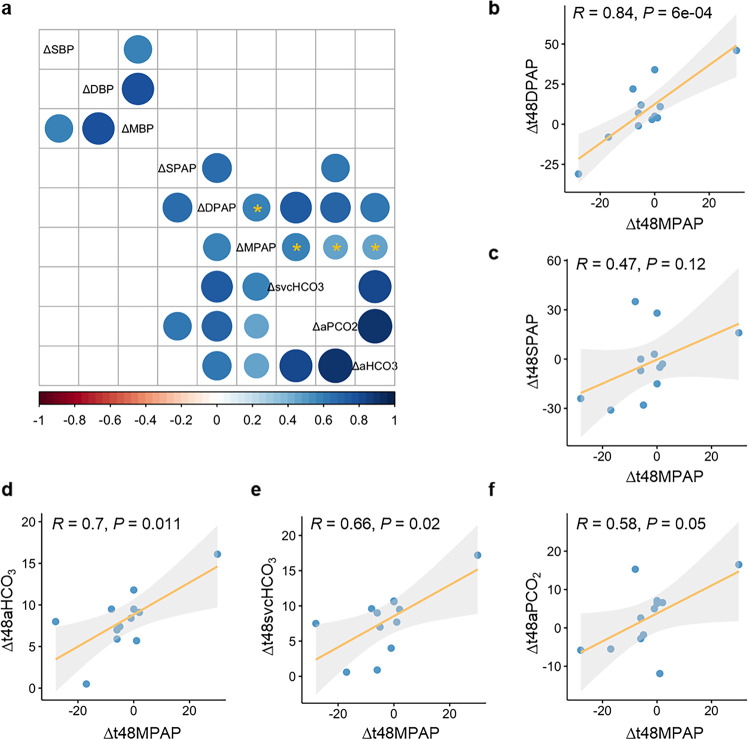
Fig. 4. Correlation of gradients in clinical characteristics.
a Correlation of gradients in clinical characteristics, including hemodynamics and clinical parameters of blood-gas analysis between time point of T48 and Pre; SBP: systolic blood pressure, DBP: diastolic blood pressure, MBP: mean blood pressure, SPAP: systolic pulmonary arterial pressure, DPAP: diastolic pulmonary arterial pressure, MPAP: mean pulmonary arterial pressure, svcHCO3: bicarbonate in superior vena cava, aHCO3: bicarbonate in radial artery, aPCO2: the partial pressure of dissolved CO2 gas in radial artery. All the significant correlations between clinical characteristics were shown as a circle in the square and nonsignificant correlations were shown as blank square, The higher the positive correlation is, the darker the color of blue will be, and the higher the negative correlation is, the darker the color of red will be; clinical characteristics significantly correlated with MPAP gradient were denoted with an asterisk (P < 0.05). b–f Scatter plot depicts the correlation of gradient in (b) DPAP; (c) SPAP; (d) aHCO3; (e) svcHCO3, and (f) aPCO2 with MPAP gradient between the time point of T48 and Pre, respectively. Δ denotes the alteration of the indicated clinical parameters. Δt48MPAP, Δt48DPAP, and Δt48SPAP represents the gradient of mean pulmonary arterial pressure, diastolic pulmonary arterial pressure, and systolic pulmonary arterial pressure between T48 and Pre, respectively. Δt48aHCO3, Δt48svcHCO3, and Δt48aPCO2 represents the change of bicarbonate in radial artery, bicarbonate in the superior vena cava, and partial pressure of dissolved CO2 gas in radial artery between T48 and Pre, respectively.

