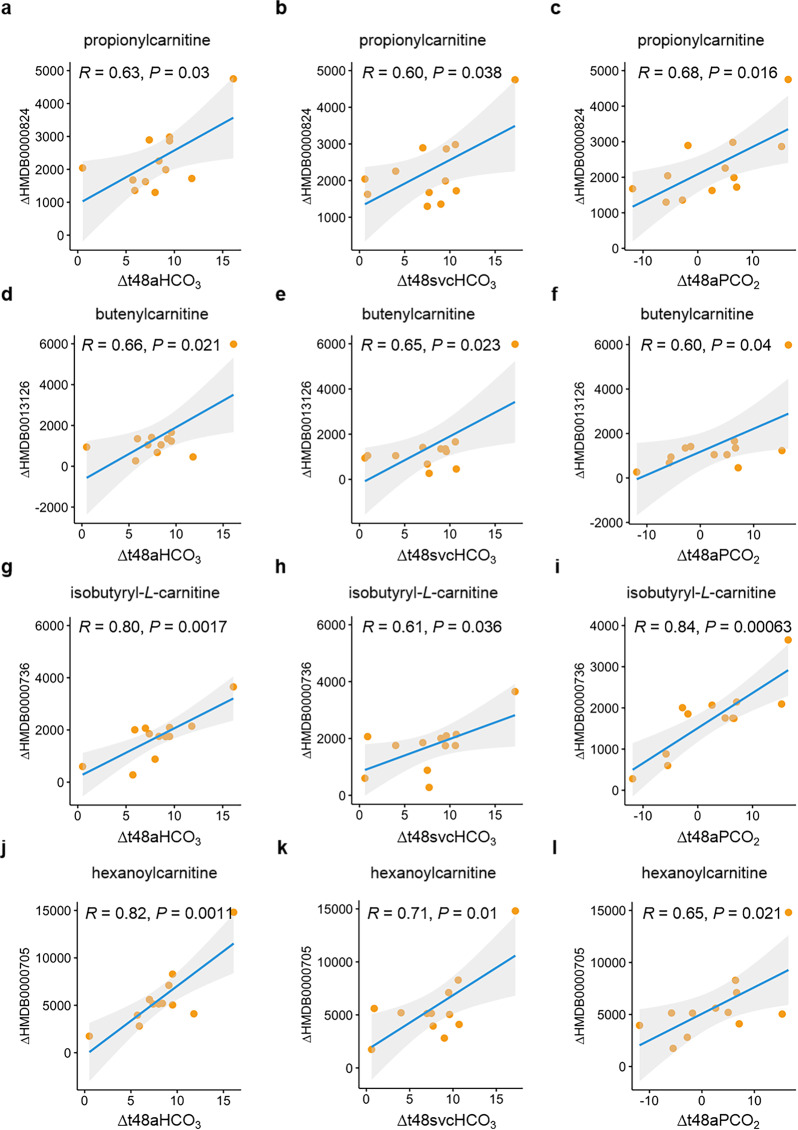
Fig. 5. Correlation of metabolite alteration with clinical-parameter gradients in arterial blood-gas analysis.
a–c Correlation of propionylcarnitine variation with gradients in (a) bicarbonate in radial artery (aHCO3), (b) bicarbonate in the superior vena cava (SvcHCO3), (c) partial pressure of dissolved CO2 gas in radial artery (aPCO2) between the time point of T48 and Pre. d–f Correlation of butenylcarnitine variation with gradients in (d) aHCO3, (e) SvcHCO3, and (f) aPCO2 between the time point of T48 and Pre. g–i Correlation of isobutyryl-L-carnitine variation with gradients in (g) aHCO3, (h) SvcHCO3, (i) aPCO2 between the time point of T48 and Pre. j–l Correlation of hexanoylcarnitine variation with gradients in (j) aHCO3, (k) SvcHCO3, (l) aPCO2 between the time point of T48 and Pre. Δ denotes the alteration of the indicated clinical parameter or metabolite. Δt48aHCO3, Δt48svcHCO3, and Δt48aPCO2 represents the gradients of bicarbonate in radial artery, bicarbonate in the superior vena cava, and partial pressure of dissolved CO2 gas in radial artery between T48 and Pre, respectively. ΔHMDB0000824, ΔHMDB0013126, ΔHMDB0000736, and ΔHMDB0000705 represents the change of metabolites propionylcarnitine, butenylcarnitine, isobytyryl-L-carnitine, and hexanoylcarnitine at T48 versus that at Pre, respectively.

