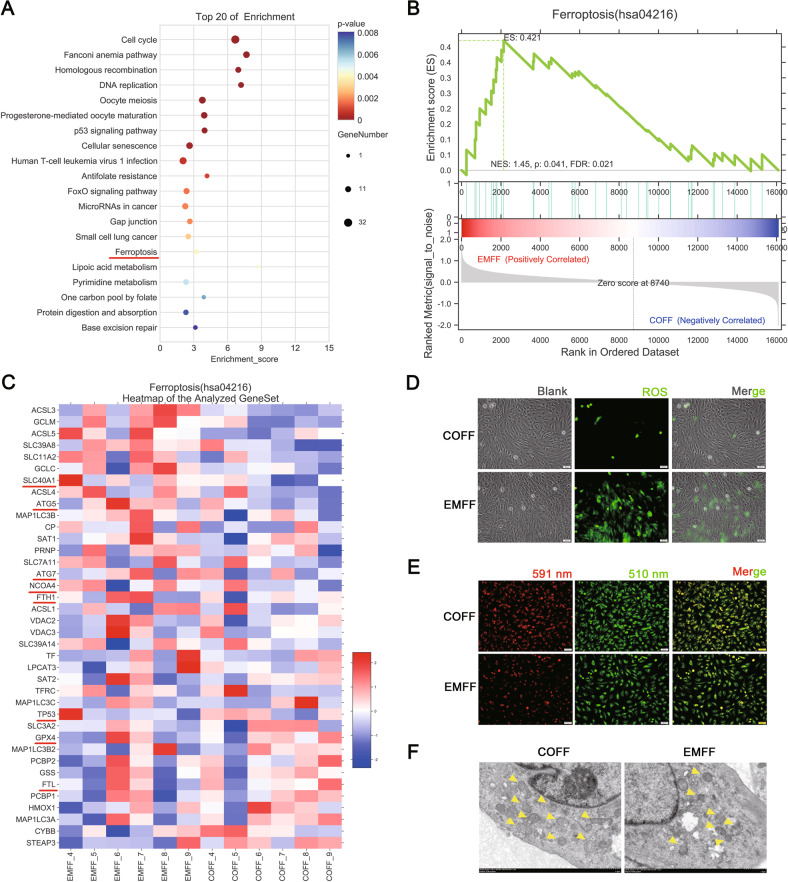
Fig. 1. EMFF-induced granulosa cell ferroptosis.
A KEGG enrichment top 20 bubble plot of KGN after EMFF treatment. The horizontal axis in the plot is the enrichment score. The larger the bubble, the greater the number of differential genes included. The lower the enrichment P value is, the higher the degree of significance. B GSEA analysis plot. Each line in the middle part of the figure represents one gene in the gene set and its ranked position in the gene list. The bottom part is a matrix of gene-phenotype associations, with red being positively correlated with EMFF and blue being positively correlated with COFF. FDR < 0.25 was set as credible enrichment. C Heatmap of transcript differential protein-coding genes (fold change > 2) between EMFF-KGN (n = 6) and COFF-KGN (n = 6). Red indicates relatively high expression protein-coding genes, and blue indicates relatively low expression protein-coding genes. D Representative images of ROS levels of EMFF-KGN and COFF-KGN under fluorescence staining. The green markers represent ROS level. Scale bar = 50 µm. E Representative images of C11-BODIPY (581/591) staining in EMFF-KGN and COFF-KGN groups. 591 nm represents the reduction state and 510 nm represents the oxidation state. Scale bar = 50 µm. F The mitochondrial morphology of COFF-KGN and EMFF-KGN was observed by TEM. Yellow arrows indicate mitochondrion. Scale bar = 1.0 µm.

