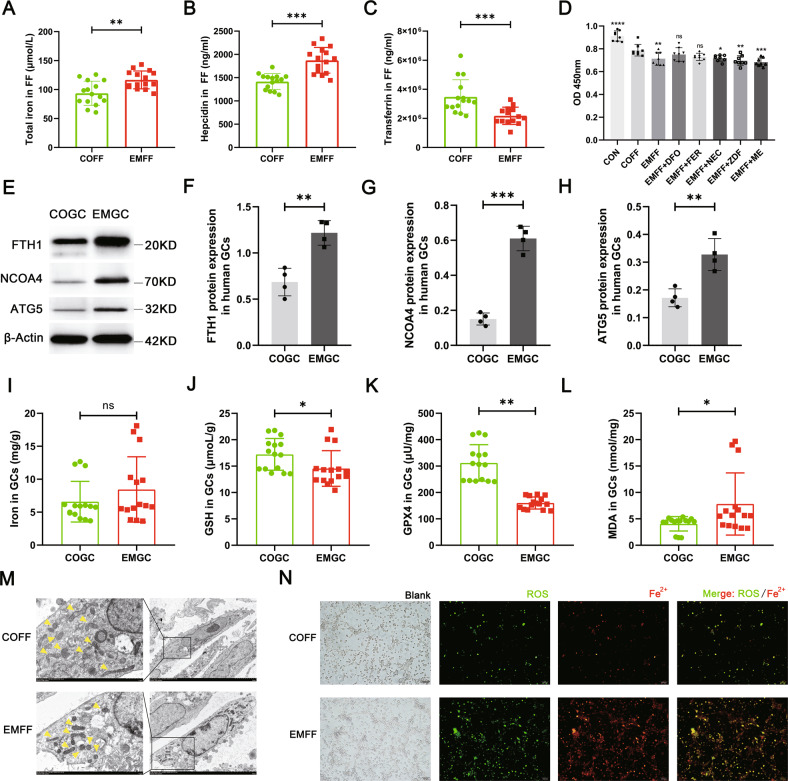
Fig. 2. Iron-overloaded EMFF induced ferritinophagy-dependent ferroptosis in granulosa cells.
A–C Levels of total iron, hepcidin, and transferrin in EMFF (n = 15) and COFF (n = 15). Data are expressed as means ± SD and analyzed by Student’s t test. D Results of mouse granulosa cells proliferation under different intervention conditions (each group in the figure is compared with COFF group). DFO, iron chelators; FER, ferroptosis inhibitor; NEC, necrosis inhibitor; ZDF, apoptosis inhibitor; ME, autophagy inhibitor. Data are expressed as means ± SD and analyzed by one-way ANOVA. E–H Comparison of ferritinophagy-related proteins FTH1, NCOA4, and ATG5 between human granulosa cells of infertile patients with EMs (EMGC) and of control group (COGC). The expression of β-actin was used as an internal control. Data are expressed as means ± SD and analyzed by Student’s t test. I–L Detection of ferroptosis-related indicators iron, GSH, GPX4, and MDA in COGC and EMGC. Data are expressed as means ± SD and analyzed by Student’s t test. M Representative images of the mitochondrial morphology of mouse granulosa cells intervened by COFF and EMFF were observed under TEM. Yellow arrows indicate mitochondrion. Scale bar = 1.0 µm. Scale bar = 5.0 µm. N Representative images of ROS and ferrous ion fluorescence staining after COFF and EMFF intervention in mouse granulosa cells. Scale bar = 100 µm. *P < 0.05, **P < 0.01, ***P < 0.001, ****P < 0.0001, and ns, no significance.

