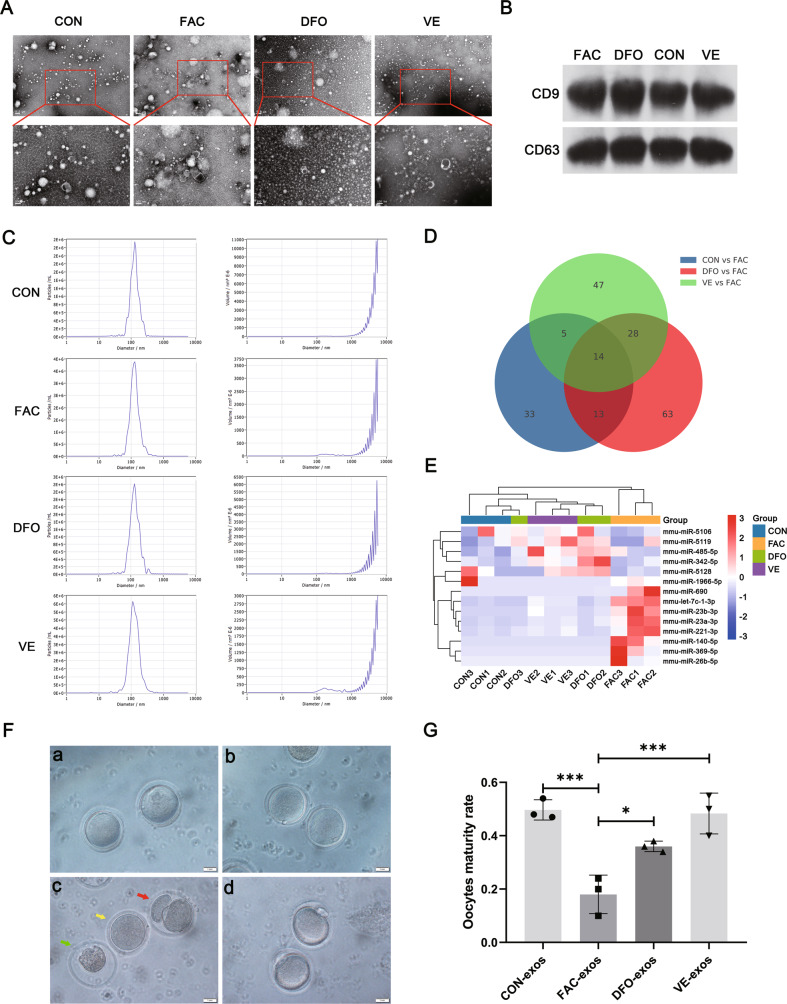
Fig. 4. Characterization of exosomes from mouse granulosa cell and their effects on oocytes under different conditions.
A Representative images of exosomes of mouse granulosa cells in control group (CON), iron overload group (FAC), iron chelators group (DFO), and vitamin E group (VE) were observed by TEM. Scale bar = 0.2 µm; Scale bar = 100 nm. B Western blot analysis of exosome-related markers CD63 and CD9 in different groups. C Nanoparticle tracking analysis of the size distribution and concentration of exosomes. D Venn diagram of differential miRNAs in three comparison groups. CON vs FAC includes differential gene expression of exosomal microRNAs between CON and FAC groups, DFO vs FAC includes differential gene expression of exosomal microRNAs between DFO and FAC groups and VE vs FAC includes differential gene expression of exosomal microRNAs between VE and FAC groups (P < 0.05, fold change ≥ 1.5). E Heatmap of the expression levels of the 14 differential miRNAs in each group from the (D) Venn diagram. Red represents relatively high expression and blue represents relatively low expression. F Representative images of morphological appearance of oocytes after intervention by exosomes under microscope. Both figures a and b were germinal vesicles stage oocytes. Red arrow indicates parthenogenetic activation, yellow arrow indicates germinal vesicle breakdown stage, and green arrow indicates dead oocytes in figure c. Figure d was the second meiotic metaphase awaiting fertilization stage oocytes. Scale bar = 1.0 mm. G Maturation rate of oocytes in each group after intervention of mouse granulosa cell exosomes treated using different methods. Data are expressed as means ± SD and analyzed by one-way ANOVA. *P < 0.05 and ***P < 0.001.

