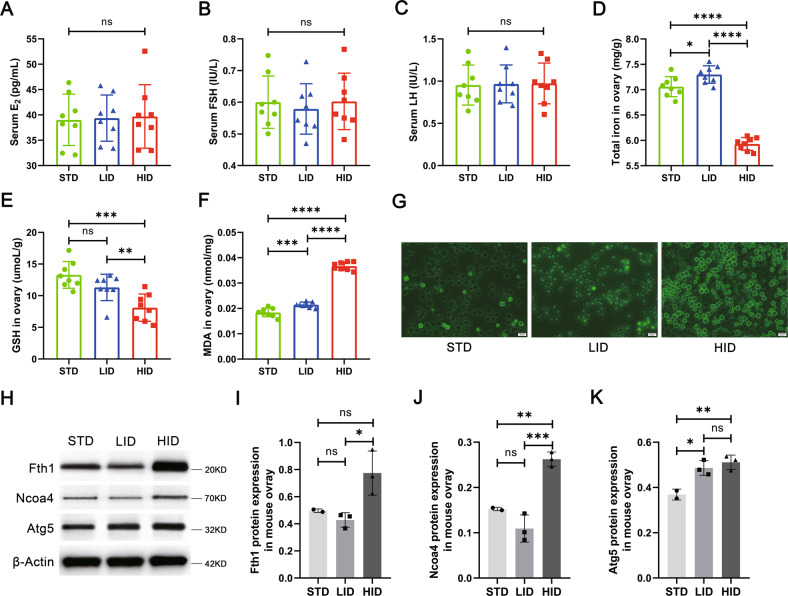
Fig. 5. Construction of an iron overload mouse model.
A–C Serum levels of E2, FSH, and LH in standard iron (STD), low iron (LID), and high iron (HID) diet feeding groups (n = 8). D–F Total iron, GSH, and MDA levels in the ovary tissues of mice in each group (n = 8). G Representative images of ROS fluorescence staining of ovarian mouse granulosa cells in three groups of mice. Scale bar = 20 µm. H–K Western blot analysis of ferritinophagy-related proteins, FTH1, NCOA4, and ATG5 in mouse ovary tissues in the STD, LID, and HID group. The expression of β-actin was used as an internal control. All data are expressed as means ± SD and analyzed by one-way ANOVA. *P < 0.05, **P < 0.01, ***P < 0.001, ****P < 0.0001, and ns, no significance.

