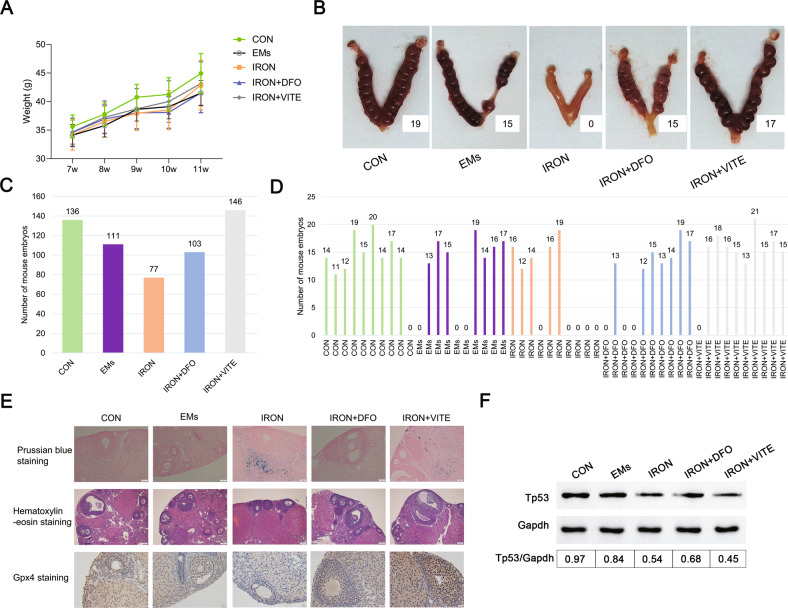
Fig. 6. EMs combined with iron overload modeling affected mouse pregnancy.
A The average body weight of the pregnant mice was calculated from control (CON, n = 10), EMs model (EMs, n = 10), EMs combined with iron overload model (IRON, n = 10), DFO treatment after IRON model (IRON + DFO, n = 10), and VITE treatment after IRON model (IRON + VITE, n = 10). B Representative photographs of the uterus after pregnancy in each of the five groups of female mice. C, D Total litter size and specific number of litters per mouse in five groups (n = 10). E For Prussian blue, H&E, and GPX4 immunohistochemical staining, ovarian tissues were observed from the five groups of mice. Scale bar = 50 µm; Scale bar = 200 µm; Scale bar = 20 µm. F Western blot analysis of TP53 expression in the ovarian tissues of mice in each group. Expression of GAPDH was used as an internal control.

