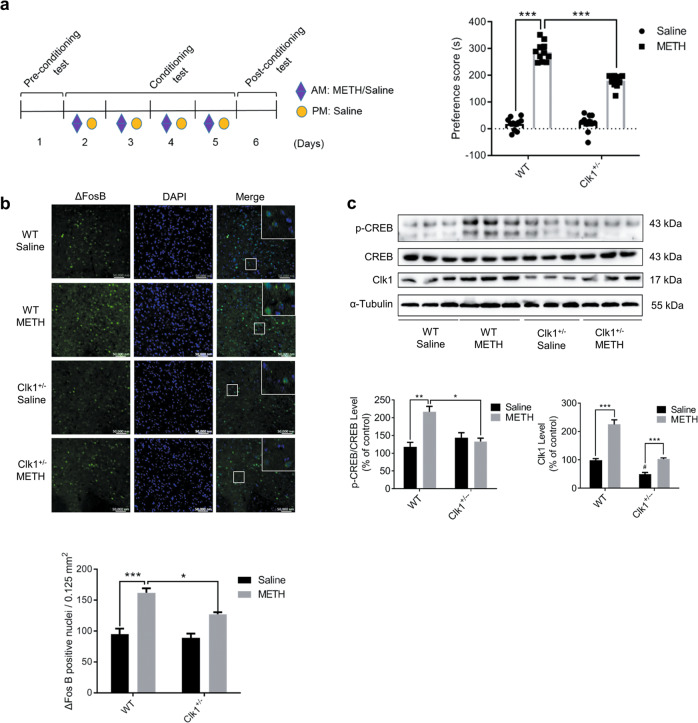
Fig. 1. Clk1 deficiency inhibits methamphetamine (METH)-induced conditioned place preference (CPP) and suppresses the expression of ΔFosB and phosphorylation of CREB in mice.
a CPP schematic diagram. WT and Clk1+/− mutant mice were each divided into saline and METH groups. During the conditioning test, mice in the drug group received repeated i.p. injections of METH (2 mg/kg) in the drug-paired compartment and saline in the other compartment to develop CPP over 4 consecutive days, while controls received saline on each occasion. In the post-conditioning test, time spent in the two compartments was recorded and a preference score was calculated as the difference in time spent in the drug-paired compartment between post- and pre-conditioning tests (n = 11 animals per group). b Immunofluorescence images (scale bar, 50,000 nm) of ΔFosB in NAc from WT or Clk1+/− mutant mice that had received the above METH/saline treatments, with tissue collected 24 h after CPP testing (at least 3 animals per group). c Whole striatal tissue from each group was dissected 24 h after CPP testing and processed for immunoblot assay as described in Methods. Representative images for immunofluorescence and immunoblots are shown in the upper panel and quantitative data are shown in the lower panels. Bar graphs are presented as means ± SEM with data obtained from at least 3 animals. Statistical analyses were performed using two-way ANOVA followed by Bonferroni-corrected tests (*P < 0.05, **P < 0.01, ***P < 0.001; #P < 0.05 vs WT).

