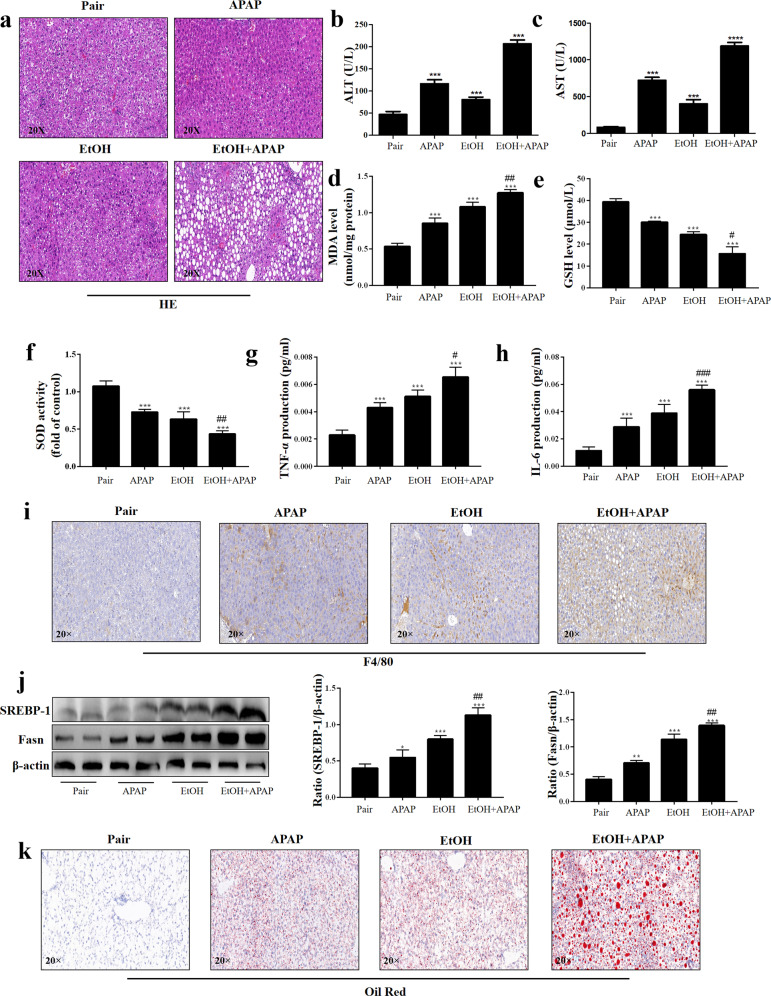
Fig. 1. EtOH aggravated APAP-induced liver injury in C57BL/6 J mice.
a Liver tissues stained with HE. b, c Serum ALT and AST assay. d–f Levels of MDA, GSH, and SOD in serum; (g-h). Levels of TNF-α and IL-6 in serum. i IHC and quantitative analysis of F4/80. j The expression levels of SREBP-1 and Fasn detected by real-time PCR and Western blotting. k Oil Red O staining in mice. *P < 0.05, **P < 0.01, ***P < 0.001, ****P < 0.0001 vs Pair group. #P < 0.05, ##P < 0.01, ###P < 0.001 vs APAP or EtOH alone group.

