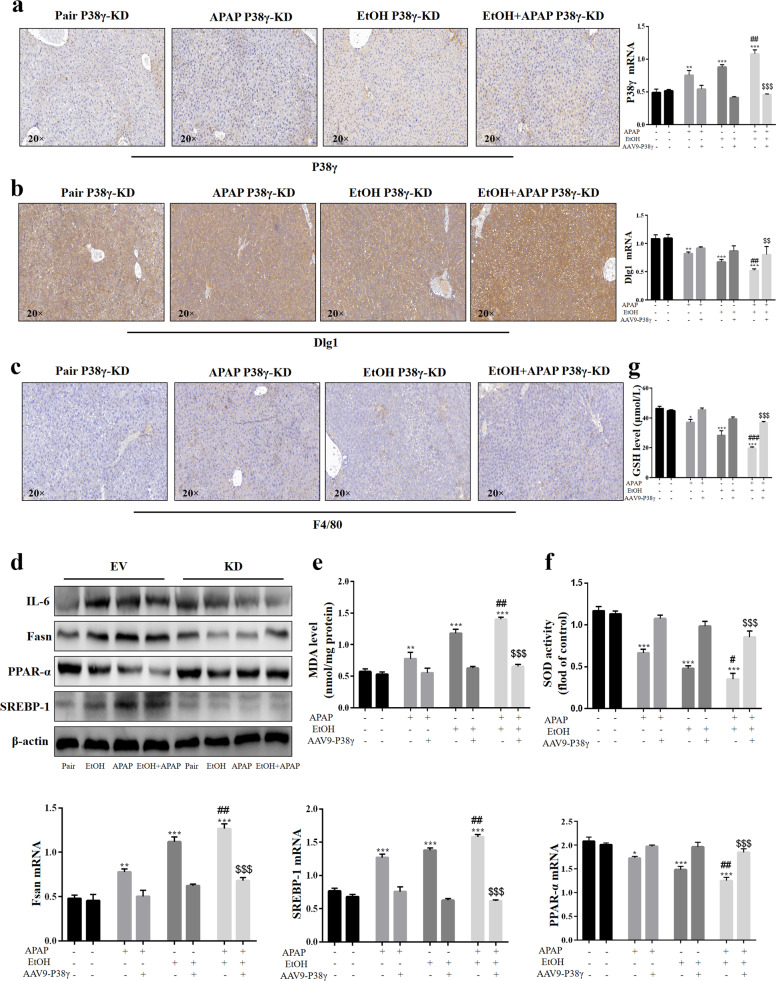
Fig. 9. P38γ KD protected against liver inflammation, lipid accumulation and oxidative stress in EtOH- and APAP-induced mice.
a–c IHC analysis of p38γ, Dlg1, and F4/80. d The protein expression levels of IL-6, Fasn, PPAR-α, and SREBP-1 (the cleaved nuclear (~68 kDa) forms of SREBP-1). e–g The expression levels of MDA, SOD, and GSH. *P < 0.05, **P < 0.01, ***P < 0.001 vs Normal group. ##P < 0.01, ###P < 0.001 vs APAP or EtOH alone group. $$P < 0.01, $$$P < 0.001 vs EtOH+APAP group.

