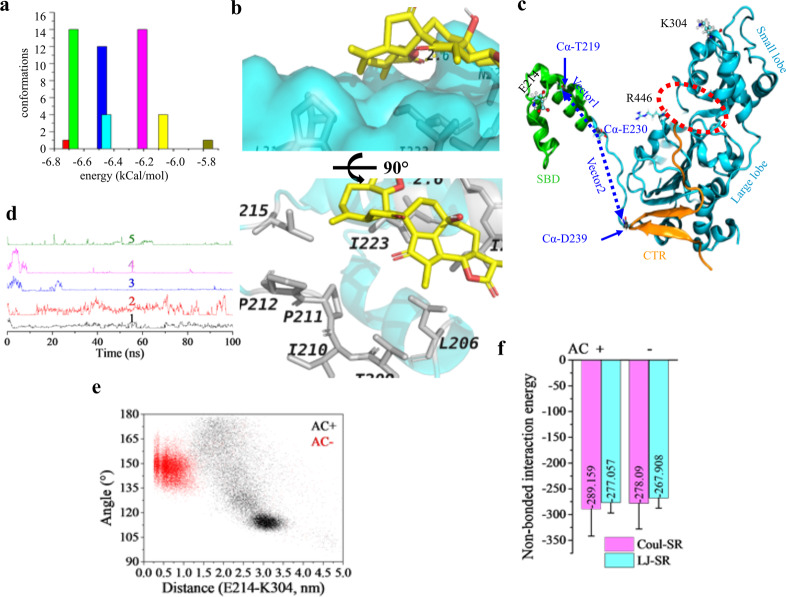
Fig. 3. AC is a potential activator of SIRT1.
a Docking results of AC to the reported allosteric activation site of SIRT1 (PDB ID: 4ZZJ). Cluster analysis of the acquired conformations from AutoDock 4.2 using a tolerance of 2.0 Å. b Interactions between AC and residues on SIRT1 of the most possible binding conformation. Residues and AC are shown in white gray and yellow sticks. Hydrogen bond is indicated in yellow dashed line. c SIRT1 structure showing key domains, amino acid pairs, and the two vectors monitored. Protein structure was shown in NewCartoon, E214 and K304 were shown in CPK, and R446 was displayed as Licorice; the red dashed circle indicates the catalytic cleft; α-carbon atoms were shown in VDW; vector defined from the Cα of E230 to that of T219 was termed as vector1 and to that of D239 was termed as vector 2. d Changes of the distance as a function of time between the carboxyl oxygen atoms of E230 and the nitrogen atoms on the guanidyl group of R446 from five independent dynamic simulations in the holo structure. e Scatter plots showing the conformation distribution in the presence/absence of AC using the angle from the two vectors and the distance between E214 and K304. f Non-bonded interaction energy between the substrate and the catalytic domain calculated from the stable trajectories of the holo structure and that in state 2 of the apo structure. Coul-SR short-range Coulomb interaction energy, LJ-SR short-range Lennard–Jones potential.

