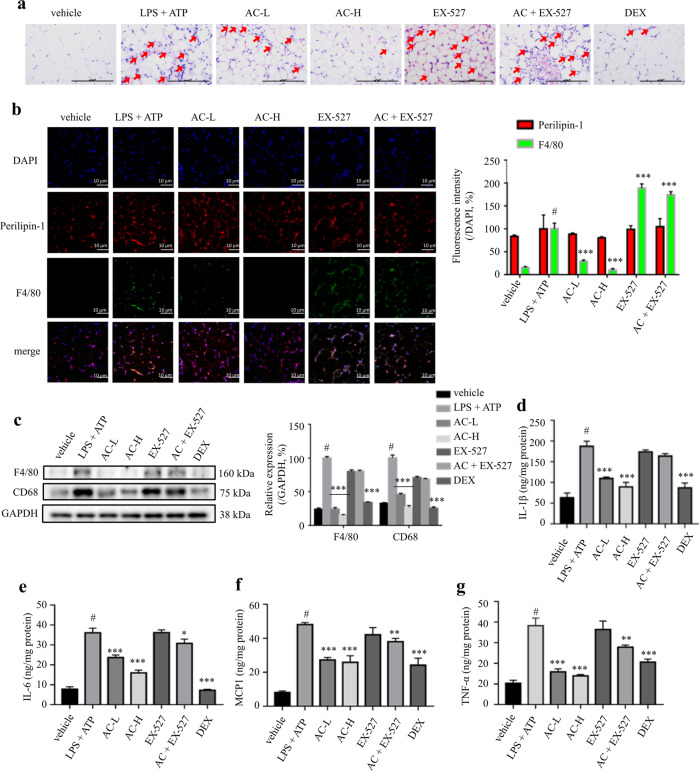
Fig. 7. AC treatment attenuated adipose tissue inflammation.
a H&E staining of eWAT sections. Red arrows indicate the infiltrated macrophages in eWAT. Scale bar = 100 μm. b Immunofluorescence staining of perilipin-1 (red, marker of adipocytes) and F4/80 (green, marker of macrophages) in eWAT. Scale bar = 10 μm. c Expression levels of F4/80 and CD68 determined by western blotting. GAPDH was chosen as an internal loading control. The levels of IL-1β (d), IL-6 (e), MCP-1 (f), and TNF-α (g) in eWAT determined by ELISA. DEX: 4 mg/kg DEX; AC-L: 20 mg/kg AC; AC-H: 60 mg/kg AC; EX-527: 10 mg/kg EX-527; AC + EX-527: 60 mg/kg AC and 10 mg/kg EX-527. Data are expressed as means ± SEM (n = 3‒5). #P < 0.05 LPS + ATP vs. vehicle; *P < 0.05, **P < 0.01, ***P < 0.001 AC-L, AC-H or DEX vs. LPS + ATP.

