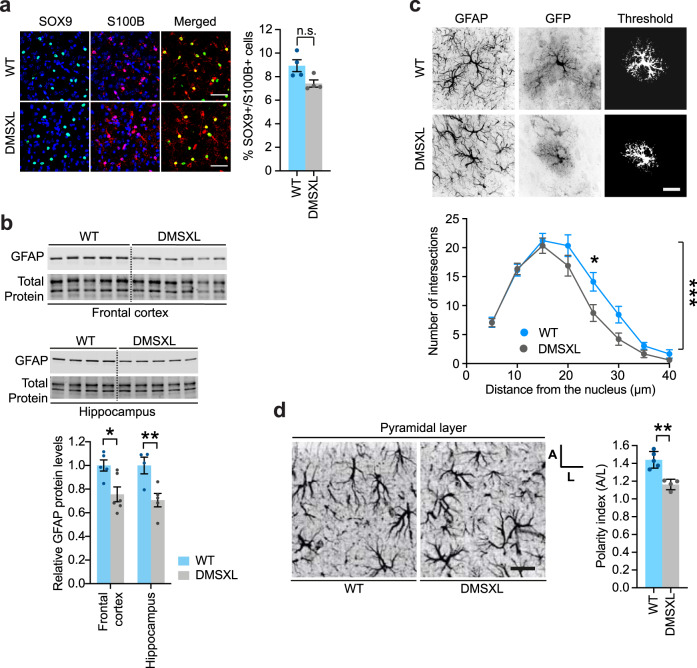
Fig. 1. DMSXL astrocytes show abnormal morphology and polarity in vivo.
a SOX9 (green) and S100B (red) immunofluorescence in DMSXL frontal cortex at 1 month. Nuclei are stained with DAPI (blue). Scale bar, 50 µm. Quantification of double labeled astrocytes. Data are means ± SEM. N = 4 mice, n = 6867 cells, WT; N = 4 mice, n = 6933 cells, DMSXL (p = 0.1143, Two-tailed Mann–Whitney U test). b Western blot quantification of GFAP in whole frontal cortex and hippocampus tissue lysates from DMSXL mice at 1 month. Representative stain-free protein bands are shown to illustrate total protein loading. Data are means ± SEM. Frontal cortex: n = 5, WT; n = 6, DMSXL. Hippocampus: n = 4, WT; n = 5, DMSXL (p = 0.0165, frontal cortex; p = 0.0097, hippocampus; Two-way ANOVA, Sidak post hoc test for multiple comparisons). c Sholl analysis of the branching of DMSXL cortical astrocytes at 1 month. Representative pictures illustrating the specificity of the GFP labeling in astrocytes expressing the GFAP marker. GFP signal was analyzed by applying the same threshold to all images. Scale bar, 20 µm. Data are means ± SEM. N = 5 mice, n = 20 cells, WT; N = 4 mice, n = 20 cells, DMSXL (p = 0.0007, Two-way ANOVA; p = 0.0119, 25 µm, Sidak post hoc test for multiple comparisons). d Analysis of astrocyte polarity with respect to the pyramidal cell layer in 1-month-old mice. Schematic representation of grid-baseline analysis for orientation quantification of GFAP-labeled CA1 stratum radiatum astrocytes. Polarity index ratio (A/L) larger than one indicates preferential perpendicular orientation towards the pyramidal layer. Scale bar, 20 μm. Data are means ± SEM. N = 4 mice, n = 59 cells, WT; N = 5 mice, n = 64 cells, DMSXL (p = 0.0013, Two-tailed Student’s t test). n.s. not significant; *p < 0.05; **p < 0.01; ***p < 0.001. Source data are provided as a Source Data file.

