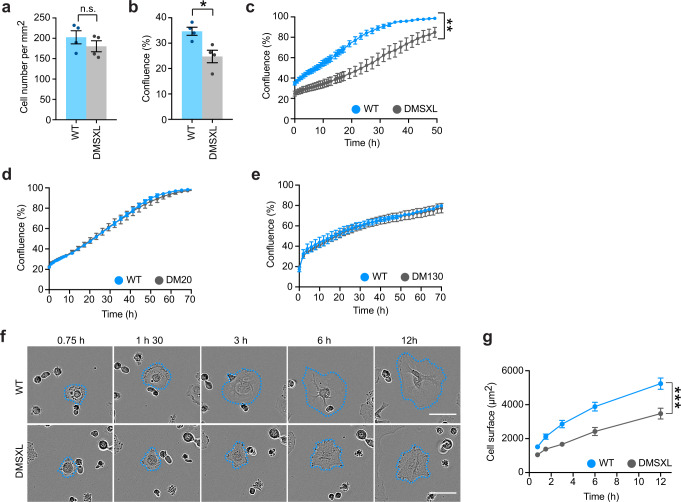
Fig. 3. Primary DMSXL astrocytes exhibit abnormal adhesion and spreading.
a Quantification of the number of DMSXL and WT astrocytes attached 45 min after plating. Data are means ± SEM, n = 4 independent cultures per genotype (p = 0.3429, Mann–Whitney U test). b Semi-automated quantification of cell culture confluence 45 min after plating. Data are means ± SEM, n = 4 independent cultures per genotype (p = 0.0286, Two-tailed Mann–Whitney U test). c Videomicroscopy semi-automated monitoring of DMSXL and WT astrocyte confluence, from 45 min after plating up to 48 h in culture. Data are means ± SEM, n = 4 independent cultures per genotype (p = 0.0048, Two-way repeated measures ANOVA). d Quantification of the confluence of DM20 and WT astrocyte cultures over time. Data are means ± SEM, n = 7 independent cultures per genotype. e Quantification of the confluence of DM130 and WT astrocyte cultures over time. Data are means ± SEM; n = 4 WT independent cultures; n = 3 DM130 independent cultures. f Representative time-lapse bright field images of primary DMSXL and WT astrocytes, over 12 h after plating. Scale bar, 50 μm. The experiment was performed on three independent cultures of each genotype. g Quantification of the surface of individual primary astrocytes over time (N = 3 independent cultures per genotype; n = 72 cells, WT; n = 64 cells, DMSXL). Data are means ± SEM (p < 0.001, Two-way repeated measures ANOVA). Source data are provided as a Source Data file. n.s., not significant; *p < 0.05; **p < 0.01; ***p < 0.001.

