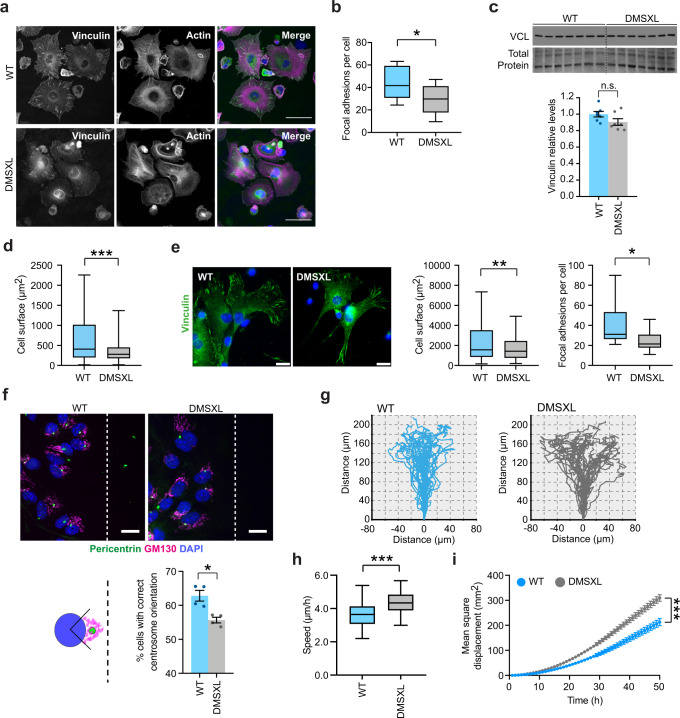
Fig. 4. DMSXL astrocytes show defects in focal adhesion organization, cytoskeleton reorientation, and cell migration.
a Immunofluorescence of vinculin-rich focal adhesions and staining of actin cytoskeleton with phalloidin in DMSXL and WT astrocytes, following 3 h in culture. Scale bar, 50 μm. The experiment was performed on two independent cultures of each genotype. b Quantification of focal adhesions, assessed by the number of vinculin-rich clusters. Tukey whisker plots represent the number of focal adhesions per cell. N = 2 independent cultures per genotype; n = 538 cells, WT; n = 609 cells, DMSXL (p = 0.0144, Two-tailed Student’s t test). c Western blot quantification of vinculin expression in primary DMSXL and WT astrocytes. Representative stain-free protein bands are shown to illustrate total protein loading. Data are means ± SEM; n = 7 independent cultures per genotype (p = 0.0934, Two-tailed Mann–Whitney U test). d Measurement of actin cytoskeleton spreading. Data are shown as Tukey whisker plots. N = 2 independent cultures per genotype; n = 440 cells, WT; n = 487 cells, DMSXL (p < 0.0001, Two-tailed Mann–Whitney U test). e Immunofluorescence of vinculin and detection of focal adhesions in mouse cortical astrocytes acutely isolated at 1 month of age, 3 days after plating. Scale bar, 20 μm. Tukey whisker plots represent cell size and number of focal adhesions per cell. N = 3 independent cultures per genotype; n = 450 cells, WT; n = 543 cells, DMSXL (p = 0.0043, cell surface; p = 0.0186, focal adhesions per cell; Two-tailed Mann–Whitney U test). f Analysis of MTOC and Golgi apparatus orientation through the immunofluorescent labeling of pericentrin and GM130, respectively, 8 h after wound-induced migration. Scale bar, 20 µm. Quantification of the percentage of cells with centrosome and Golgi orientated perpendicularly to wound. Data are means ± SEM. N = 4 independent cultures per genotype; n = 2179 cells, WT; n = 2068 cells, DMSXL (p = 0.0286, Two-tailed Student’s t test). g Representative migration tracking plots of individual DMSXL and WT astrocytes over 50 h, until complete wound closure. h Tukey whisker plots show cell speed of primary astrocytes during migration. N = 2 independent cultures per genotype; n = 39 cells, WT; n = 39 cells, DMSXL (p < 0.0001, Two-tailed Student’s t test). i Mean square displacement of primary astrocytes in culture over 50 h of cell migration, until complete wound closure. Data are means ± SEM. N = 2 independent cultures per genotype; n = 39 cells, WT; n = 39 cells, DMSXL (p < 0.0001, Two-way ANOVA). Tukey whisker plots display the median and extend from the 25th percentile up to the 75th percentiles. The whiskers are drawn down to the 10th percentile, and up to the 90th percentile. Source data are provided as a Source Data file. n.s. not significant; *p < 0.05; **p < 0.01; ***p < 0.001.

