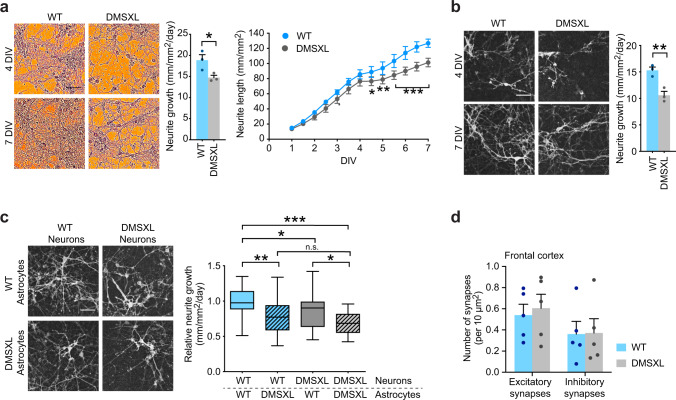
Fig. 5. DMSXL astrocytes alter neuronal neuritogenesis.
a Representative brightfield images of unlabeled DMSXL and WT neurons at 4 and 7 DIV, showing neurite arborization in culture. Fire pseudocolor was applied on phase contrast images for clearer visualization of neurites. Scale bar, 50 μm. Semi-automated, label-free quantification of neurite growth rate and neurite length over 7 DIV. Data are means ± SEM. n = 3 independent cultures per genotype (p = 0.0436, Two-tailed Student’s t test, neurite growth; p = 0.0103, 4.5 DIV, p = 0.0012, 5.0 DIV, p < 0.0001, 5.5–7.0 DIV, Two-way ANOVA, Sidak post hoc test for multiple comparisons, neurite length). b Representative images of mKate2-expressing neurons in the same DMSXL and WT cultures at 4 and 7 DIV. Scale bar, 50 μm. Fluorescent signal was first detected at 4 DIV, and quantification of neurite growth by semi-automated time-lapse videomicroscopy was performed from 4 to 7 DIV. Data are means ± SEM. n = 3 independent cultures per genotype (p = 0.0083, Two-tailed Student’s t test). c Representative images of mKate2-expressing red fluorescent DMSXL and WT neurons co-cultured with unlabeled DMSXL and WT astrocytes. Scale bar, 50 μm. Quantification of the impact of astrocyte genotype on DMSXL and WT neurite growth. Tukey whisker plots represent neurite growth relative to normalized WT/WT co-cultures. N = 4 independent co-cultures per experiment, n = 22 neurons per condition (p = 0.0032, WTneurons/WTastrocytes vs WTneurons/DMSXLastrocytes; p = 0.0451, DMSXLneurons/WTastrocytes vs DMSXLneurons/DMSXLastrocytes; p < 0.0001, WTneurons/WTastrocytes vs DMSXLneurons/DMSXLastrocytes; p = 0.0124, WTneurons/WTastrocytes vs DMSXLneurons/WTastrocytes; p = 0.1244, WTneurons/DMSXLastrocytes vs DMSXLneurons/DMSXLastrocytes; One-way ANOVA, Sidak post hoc test for multiple comparisons). The plots display the median and extend from the 25th percentile up to the 75th percentiles. The whiskers are drawn down to the 10th percentile, and up to the 90th percentile. d Number of excitatory synapses assessed by co-localized clusters of VGLUT1 and HOMER1, and inhibitory synapses assessed by co-localized clusters of GAD1/GAD2 (GAD65/GAD67) and GPHN (gephyrin) in the frontal cortex of DMSXL and WT mice, at 1 month of age. Data are means ± SEM. N = 5 mice per genotype, n = 3 fields per mouse. Source data are provided as a Source Data file. n.s. not significant; *p < 0.05; **p < 0.01; ***p < 0.001.

