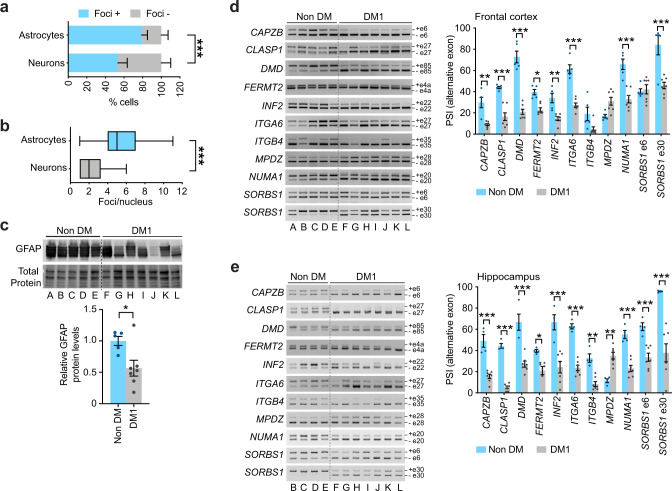
Fig. 9. Pronounced foci accumulation in astrocytes and splicing dysregulation of adhesion and cytoskeleton-related transcripts in human DM1 brains.
a Percentage of GFAP-positive astrocytes and MAP-positive neurons exhibiting nuclear RNA foci in the frontal cortex of DM1 patients (p < 0.0001, χ2 test). Data are means ± SEM, N = 3 individuals, n = 152 astrocytes, n = 101 astrocytes. b Tukey whisker plots representing the number of foci per nucleus in human cortical astrocytes and neurons (p < 0.0001, Two-tailed Mann–Whitney U test). The plots display the median and extend from the 25th percentile up to the 75th percentiles. The whiskers are drawn down to the 10th percentile, and up to the 90th percentile. N = 3 DM1 patients; n = 284, astrocytes; n = 202, neurons. c Western blot quantification of GFAP in tissue lysates prepared from post-mortem human frontal cortex. Representative stain-free protein bands are shown to illustrate total protein loading. Data are means ± SEM. n = 5, non-DM; n = 7, DM1 (p = 0.0480, Two-tailed Mann–Whitnet U test). d RT-PCR splicing analysis of adhesion- and cytoskeleton-associated transcripts in the frontal cortex of adult DM1 patients and non-DM subjects. Alternative exons are indicated on the right. Quantification of PSI of alternative exons. Data are means ± SEM. n = 5, non-DM; n = 7, DM1 (p = 0.0017, CAPZB; p < 0.0001, CLASP1, DMD, ITGA6, NUMA1, SORBS1 e30; p = 0.0233, FERMT2; p = 0.0040, INF2; p = 0.0788, ITGB4; p = 0.0919, MPDZ; p > 0.9999, SORBS1 e6; Two-way ANOVA, Sidak post hoc test for multiple comparisons). e RT-PCR splicing analysis in the hippocampus of adult DM1 patients and non-DM subjects. Alternative exons are indicated on the right. Quantification of PSI of alternative exons. Data are means ± SEM. n = 4, non-DM; n = 7, DM1 (p < 0.0001, CAPZB, CLASP1, DMD, INF2, ITGA6, NUMA1, SORBS1 e30; p = 0.0403, FERMT2; p = 0.0019, ITGB4; p = 0.0030, MPDZ; p = 0.0001, SORBS1 e6; Two-way ANOVA, Sidak post hoc test for multiple comparisons). Source data are provided as a Source Data file. *p < 0.05; **p < 0.01; ***p < 0.001.

