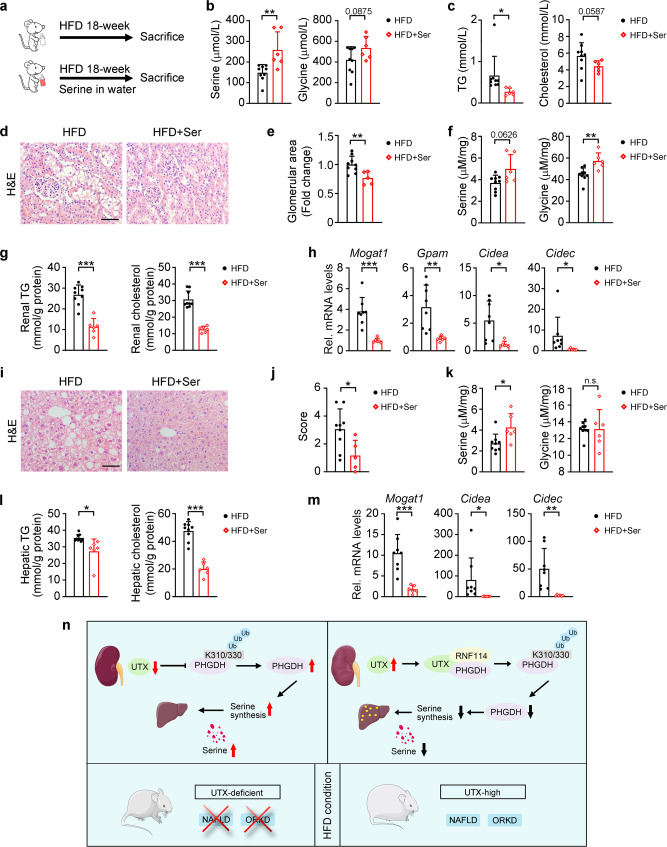
Fig. 10. Serine suppressed renal and hepatic lipid accumulation in HFD-fed mice.
a Experiment design for serine administration via drinking water. b, c Concentrations of serine, glycine, TG and cholesterol in the serum of indicated groups, n = 9, 6 independent animals for HFD or HFD + Ser group, respectively (mean ± SD). **Pserine = 0.0053; *PTG = 0.0363 (unpaired, two-tailed t-test). d–h H&E staining (d) with quantitative data for relative glomerular area (e), serine and glycine concentration (f), renal TG and cholesterol levels (g), and transcriptional levels of TG synthesis/lipid storage related genes (h) in the kidney of indicated groups, data shown as mean ± SD. e n = 9, 5 independent animals for HFD or HFD + Ser group, respectively, **PH&E = 0.0059; f, g n = 9, 6 independent animals for HFD or HFD + Ser group, respectively, **Pglycine = 0.0073; ***PTG < 0.0001, ***PCholesterol < 0.0001; (h) n = 8, 6 independent animals for HFD or HFD + Ser group, respectively, ***PMogat1 = 0.0005; **PGpam = 0.0049; *PCidea = 0.01; *PCidec = 0.0495 (unpaired, two-tailed t-test). i–m H&E staining (i), with quantitative data for relative liver steatosis score (j), serine and glycine concentration (k), hepatic TG and cholesterol levels (l) and transcriptional levels of TG synthesis/lipid storage related genes (m) in the liver of indicated groups, data shown as mean ± SD. j n = 9, five independent animals HFD or HFD + Ser group, respectively, *PH&E = 0.0197; (k–l) n = 9, 6 independent animals for HFD or HFD + Ser group, respectively, *Pserine = 0.0377; *PTG = 0.0437, ***PCholesterol < 0.0001; (m) n = 8, 6 independent animals for HFD or HFD + Ser group, respectively, ***PMogat1 = 0.0008, *PCidea = 0.0495, **PCidec = 0.0072 (unpaired, two-tailed t-test). n Possible mechanisms in present study. Scale bar, 50 μm. Source data are provided in the Source Data file.

