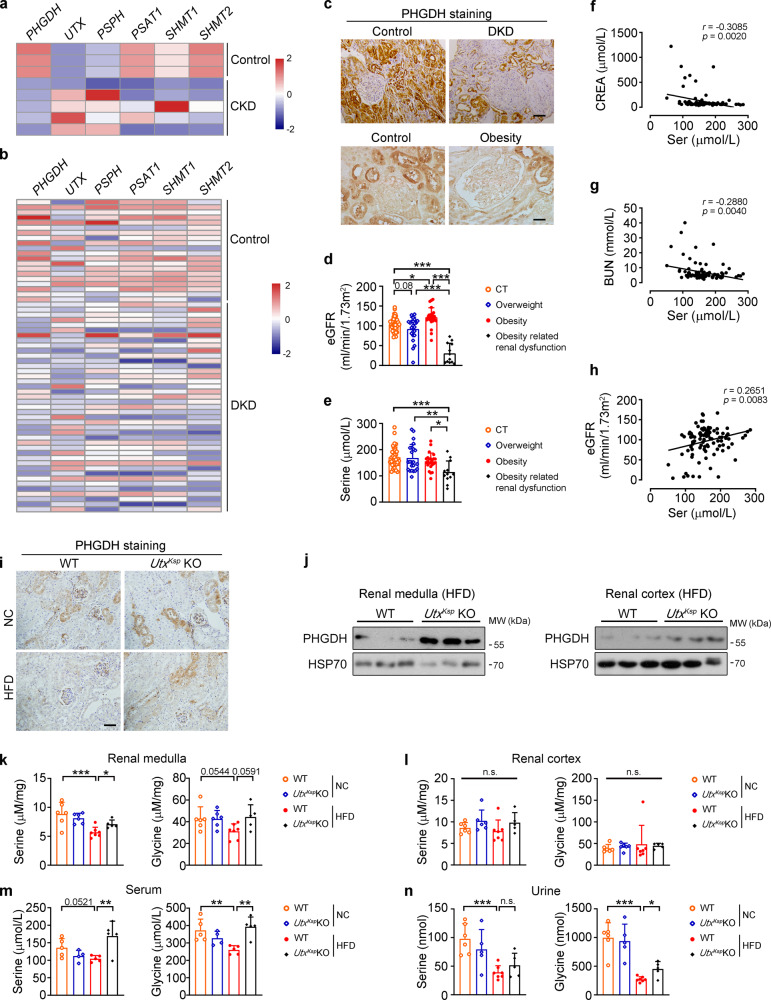
Fig. 5. Increased renal PHGDH and serine levels in UtxKsp KO mice under HFD stress.
a, b Microarray data of de novo serine synthesis genes and UTX in the kidneys of patients with chronic kidney disease (CKD; a) or diabetic kidney disease (DKD; b). c Representative images of PHGDH staining in the kidneys of patients with DKD (top) and obesity (bottom); n = 4-9; scale bar, 50 μm. Brown color indicates positive staining. d–g eGFR (d), serum serine level (e), correlation analysis between the serum serine level and serum CREA (creatinine, f) or serum BUN (blood urea nitrogen, g) level or eGFR (h) from healthy individuals (n = 39), overweight (n = 23), obesity (n = 24) and obesity-related renal disease (n = 12). d, e data shown as mean ± SD. *PeGFR (CT vs obesity) = 0.0227, ***PeGFR (CT vs obesity related renal dysfunciton) < 0.0001, ***PeGFR (overweight vs obesity related renal dysfunciton) < 0.0001, ***PeGFR (obesity vs obesity related renal dysfunciton) < 0.0001; ***Pserine (CT vs obesity related renal dysfunciton) = 0.0004, **Pserine (overweight vs obesity related renal dysfunciton) = 0.0022, *Pserine (obesity vs obesity related renal dysfunciton) = 0.0309 (one-way ANOVA). f–h correlation analysis was performed by Pearson’s method, the Pearson correlation coefficients and p values (two-tailed test) were shown. i Representative images of renal PHGDH staining of WT and UtxKsp KO mice under NC or HFD conditions. Scale bar, 50 μm. j Western blots of PHGDH and HSP70 levels in the renal medulla and cortex of indicated groups, n = 3 independent animals. k–n Serine and glycine levels in renal medulla (k), renal cortex (l), serum (m), and urine (n) of indicated groups, data shown as mean ± SD. k–l n = 6, 6, 7, 5 independent animals for WT + NC or UtxKsp KO + NC or WT + HFD or UtxKsp KO + HFD group, respectively; (k) ***Pserine (WT+NC vs WT+HFD) = 0.0005, *Pserine (WT+HFD vs UtxKsp KO+HFD) = 0.0126; m n = 5, 4, 5, 5 independent animals for WT + NC or UtxKsp KO + NC or WT + HFD or UtxKsp KO + HFD group, respectively, **Pserine (WT+HFD vs UtxKsp KO+HFD) = 0.005; **Pglycine (WT+NC vs WT+HFD) = 0.0068, **Pglycine (WT+HFD vs UtxKsp KO+HFD) = 0.0018; (n) n = 6, 5, 7, 5 independent animals for WT + NC or UtxKsp KO + NC or WT + HFD or UtxKsp KO + HFD group, respectively, ***Pserine (WT+NC vs WT+HFD) = 0.0009; ***Pglycine (WT+NC vs WT+HFD) < 0.0001, *Pglycine (WT+HFD vs UtxKsp KO+HFD) = 0.033 (one-way ANOVA). Source data are provided in the Source Data file.

