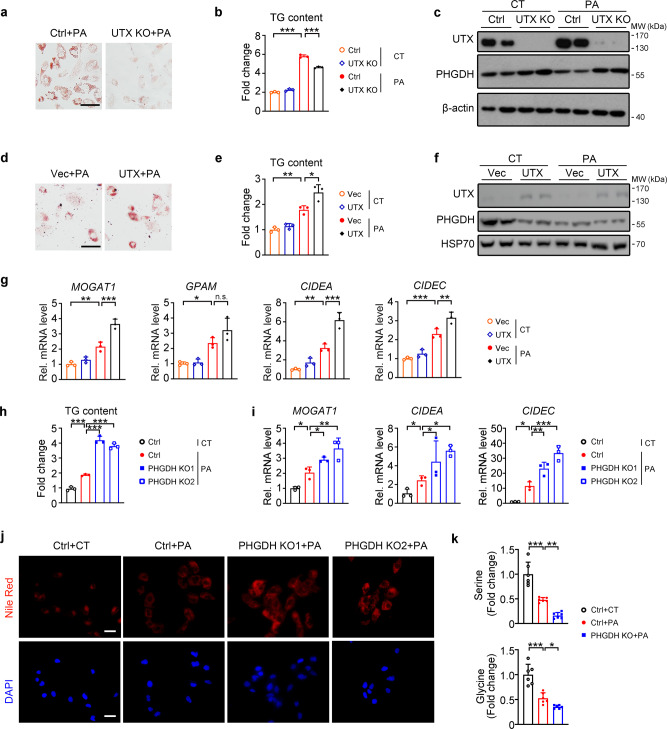
Fig. 6. UTX and PHGDH regulated lipid level in cultured renal cells.
a–c UTX knockout prevented PA-induced lipid accumulation in HK-2 cells. Oil Red O staining (a), TG level (b) and PHGDH level (c) in UTX knockout HK-2 cells with or without PA stress. b n = 3 biological samples (mean ± SD), ***PTG (Ctrl+CT vs Ctrl+PA) < 0.0001; ***PTG (Ctrl+PA vs UTX KO+PA) < 0.0001 (one-way ANOVA); (c) n = 2 biological samples per group. d–g UTX overexpression exacerbated PA-induced lipid accumulation in HK-2 cells. Oil Red O staining (d), TG level (e), PHGDH level (f) and transcriptional levels of TG synthesis/lipid storage related genes (g) in UTX overexpressing HK-2 cells. e, g n = 3 biological samples (mean ± SD), **PTG (Vec+CT vs Vec+PA) = 0.0063, *PTG (Vec+PA vs UTX+PA) = 0.0119; **PMOGAT1(Vec+CT vs Vec+PA) = 0.0033, ***PMOGAT1(Vec+PA vs UTX+PA) = 0.0009; *PGPAM (Vec+CT vs Vec+PA) = 0.0293; **PCIDEA (Vec+CT vs Vec+PA) = 0.0038, ***PCIDEA (Vec+PA vs UTX+PA) = 0.0009; ***PCIDEC (Vec+CT vs Vec+PA) = 0.0009, **PCIDEC (Vec+PA vs UTX+PA) = 0.0076 (one-way ANOVA); (f) n = 2 biological samples per group. h–k PHGDH knockout aggravated PA-induced lipid accumulation and reduced cellular serine/glycine levels in HK-2 cells. TG level (h), transcriptional levels of TG synthesis/storage related genes (i), Nile Red staining (j) and cellular serine (k, top) or glycine (k, bottom) level in PHGDH knockout HK-2 cells. Scale bar, 50 μm. h–j n = 3 biological samples per group, (k) n = 6 biological samples per group (mean ± SD). ***PTG (Ctrl+CT vs Ctrl+PA) = 0.0006, ***PTG (Ctrl+PA vs PHGDH KO1+PA) < 0.0001, ***PTG (Ctrl+PA vs PHGDH KO2+PA) < 0.0001; *PMOGAT1 (Ctrl+CT vs Ctrl+PA) = 0.0351, *PMOGAT1(Ctrl+PA vs PHGDH KO1+PA) = 0.0408, **PMOGAT1 (Ctrl+PA vs PHGDH KO2+PA) = 0.0034; *PCIDEA(Ctrl+CT vs Ctrl+PA) = 0.0230, *PCIDEA (Ctrl+PA vs PHGDH KO1+PA) = 0.0495, *PCIDEA (Ctrl+PA vs PHGDH KO2+PA) = 0.0289; *PCIDEC (Ctrl+CT vs Ctrl+PA) = 0.0158, **PCIDEC (Ctrl+PA vs PHGDH KO1+PA) = 0.0092, ***PCIDEC (Ctrl+PA vs PHGDH KO2+PA) = 0.0002; ***Pserine (Ctrl+CT vs Ctrl+PA) < 0.0001, **Pserine (Ctrl+PA vs PHGDH KO+PA) = 0.0036; ***Pglycine (Ctrl+CT vs Ctrl+PA) < 0.0001, *Pglycine (Ctrl+PA vs PHGDH KO+PA) = 0.0101 (one-way ANOVA). a–k at least three independent experiments were performed and similar results were obtained. Source data are provided in the Source Data file.

