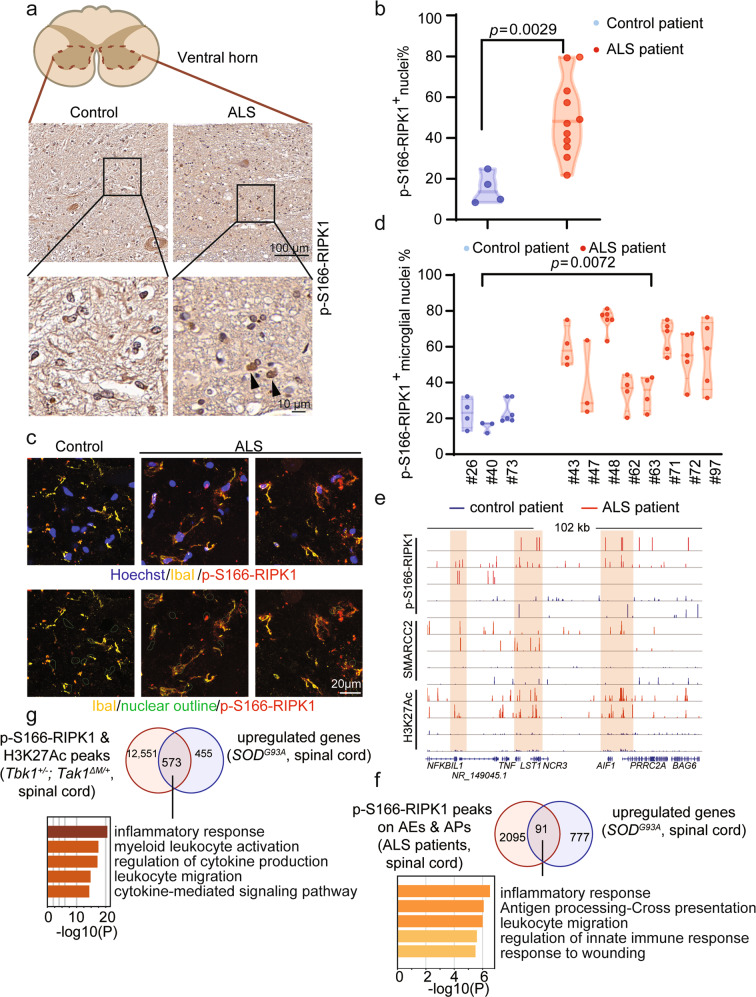
Fig. 6. Genome-wide analysis of the transcriptional targets of RIPK1 and BAF complex in ALS patients and ALS mouse model.
a, b IHC staining of upper spinal cord sections from human patients with ALS (n = 11) and age-relevant controls (n = 4). Representative images (a) and the percentage of p-S166 RIPK1+ nuclei (b) in ventral horn are shown. c, d Immunostaining of upper spinal cord sections from human patients with ALS (n = 8) and age-relevant controls (n = 3) against p-S166 RIPK1 and microglia marker IbaI. Representative images (c), quantification of the percentage of p-S166-RIPK1+ microglial nuclei (d) in ventral horn are shown. e The CUT&Tag profiles of p-S166-RIPK1, SMARCC2 genomic binding and H3K27Ac in spinal cords from ALS patients (red) and control patients (blue) on the indicated gene loci. f Venn diagram shows the intersected genes calculated by the gene targets of activated RIPK1 on AEs and APs in the spinal cords from ALS patients and the upregulated genes in the spinal cords from SOD1G93A ALS mouse model from published RNA-seq datasets. 91 overlapped target genes were analyzed by Metascape for the enriched pathways. g Venn diagram shows the intersected genes calculated by the gene targets enriched with p-S166-RIPK1/H3K27Ac peaks in the spinal cords from Tbk1+/−; Tak1ΔM/+ mice and the upregulated genes in the spinal cords from SOD1G93A ALS mouse model from published RNA-seq datasets. 573 overlapped target genes were analyzed by Metascape for the enriched pathways.

