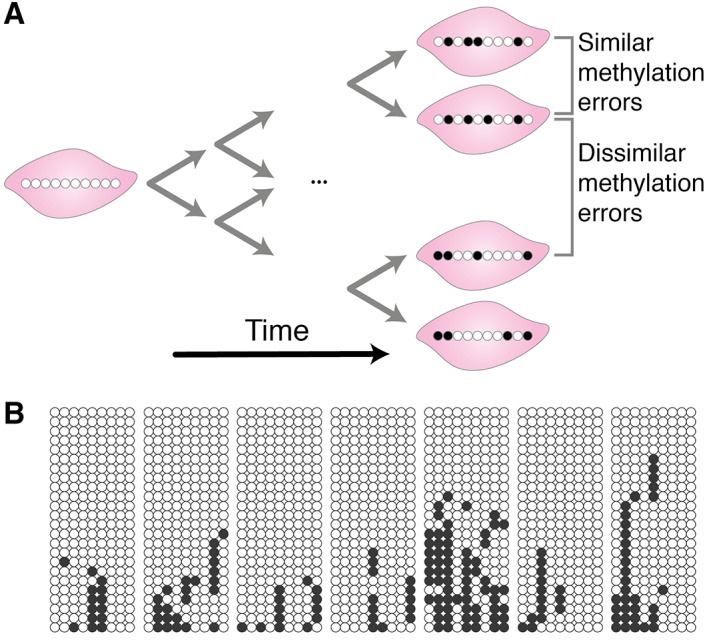
Figure 4.

DNA methylation as genetic barcodes. (A) An illustration of how somatic changes in methylation can be employed as genomic barcodes. At birth, certain CpG loci are unmethylated in every cell (white circle), but over time these CpG loci can spontaneously become methylated (black circle) in individual cells. The progeny of these cells carry the same pattern of methylation changes. Hence, the epigenetic distance between cells serves as a proxy for their relatedness. (B) Example methylation barcode data. Each circle represents a single methylated (black) or unmethylated (white) CpG locus, each row of circles corresponds to a single methylation tag, and each block represents a set of methylation tags from a single crypt, all taken from the colon of a 58‐year‐old individual. The methylation patterns within a single crypt are more similar to each other than the methylation patterns between crypts, due to the recent niche succession within the crypt. Reproduced with permission from [54].
