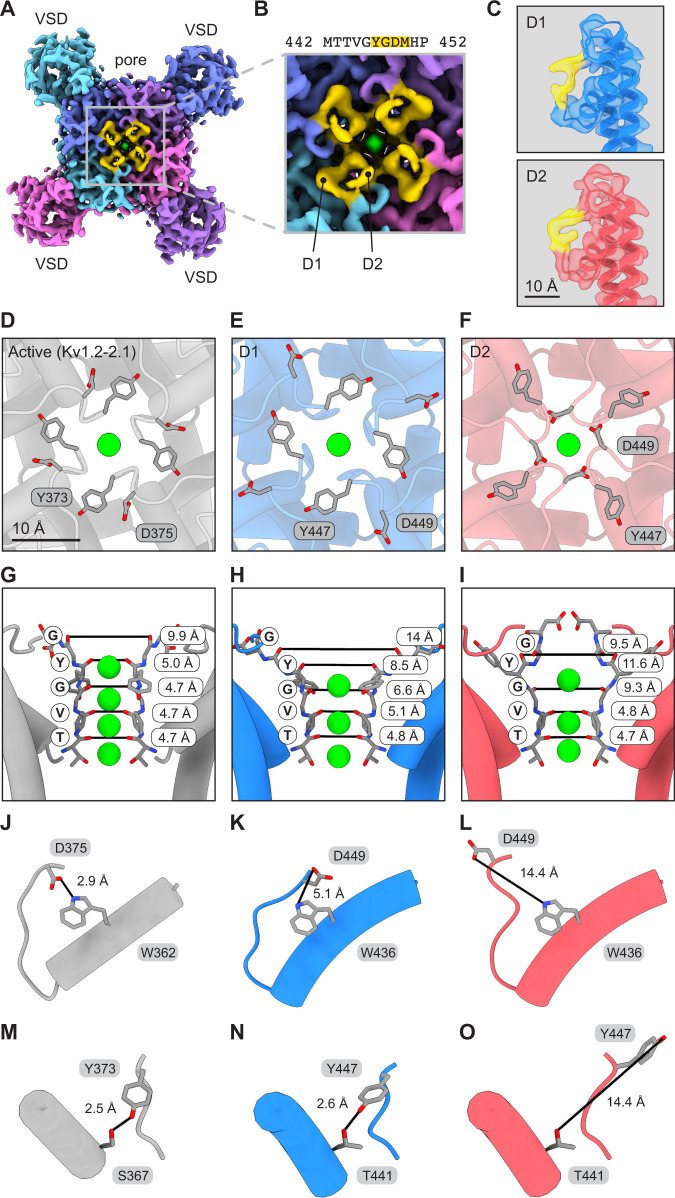
Fig. 2. The Kv1.3 selectivity filter adopts two distinct dilated conformations.
A, B Kv1.3 cryo-EM map as viewed from the extracellular space with the D1 and D2 loop regions highlighted in yellow. A shows the entire extracellular surface of the channel and B shows a magnified view of the pore region. C Cryo-EM maps for individual D1 and D2 subunits as determined by symmetry expansion and 3D classification. The maps are shown with models to highlight the different selectivity filter conformations. The region from Tyr447 to Met450 is highlighted in yellow. D–I Views of the pore for active state (Kv1.2-2.1, PDB 2R9R (Kv1.2-Kv2.1 structure)), D1 conformation, and D2 conformation. The pores are shown from the extracellular space (D–F) or from the side perspective (G–I). Distances between carbonyl oxygens of the TVGYG motif are reported and marked with black lines. J–O Asp and Trp residues (J–L) and Tyr and Ser/Thr residues (M–O) involved in hydrogen bonds that regulate C-type inactivation. Distances between hydrogen bonding partners are reported and marked with black lines. K+ ions are shown in green in panels D–I.

