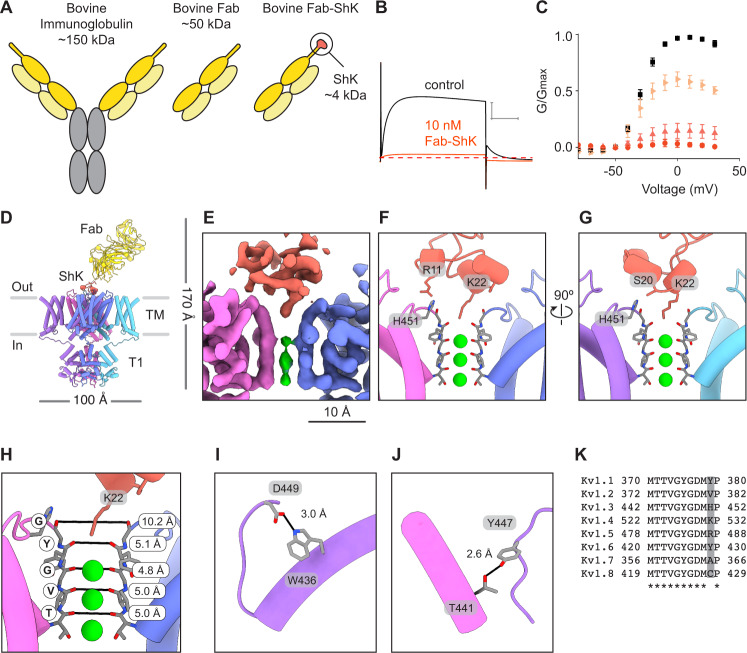
Fig. 5. Fab-ShK stabilizes a conductive pore conformation to block the channel.
A Illustration of bovine antibody which has an elongated CDR3 region compared to human antibodies, bovine Fab fragment, and Fab-ShK fusion. B Kv1.3 current traces obtained by depolarizations to 0 mV from control 2 mM K+ solutions (black) and in the presence of 10 nM Fab-ShK (orange). Holding voltage was −80 mV and tail voltage was −50 mV. Red dotted lined denotes zero current level. Scale bar indicates 5 μA and 50 ms. C G-V relations obtained in control 2 mM K+ solutions (black squares; n = 15), 0.1 nM (right facing light orange triangles; n = 4), 1 nM (upright pink triangles; n = 5) or 10 nM Fab-ShK (orange circles; n = 6) by measuring the peak of the tail current at −50 mV and normalizing it to the maximum tail current in control solution. Error bars are SEM. D Model of Kv1.3 in complex with Fab-ShK as viewed from the side, with Fab and ShK colored yellow and orange, respectively. Close up views of ShK docking at the selectivity filter of Kv1.3. The map is displayed in E and the two views of the model in F, G. The ShK residue numbers correspond to ShK alone, not their numbering in the Fab-ShK fusion. The residues Arg11, Ser20, and Lys22 of ShK correspond to Arg118, Ser127, and Lys129 in the Fab-ShK fusion. H Structure of the selectivity filter of the Kv1.3-ShK complex. Distances between carbonyl oxygens of the TVGYG motif are reported and marked with black lines. I, J Key hydrogen bonds involved in channel gating are stabilized when Kv1.3 is bound by ShK. K Sequence alignment for the selectivity filters of Kv1 channels with the position for His451 of Kv1.3 highlighted. K+ ions are shown in green in panels E–H. Source data are provided as a Source Data file.

