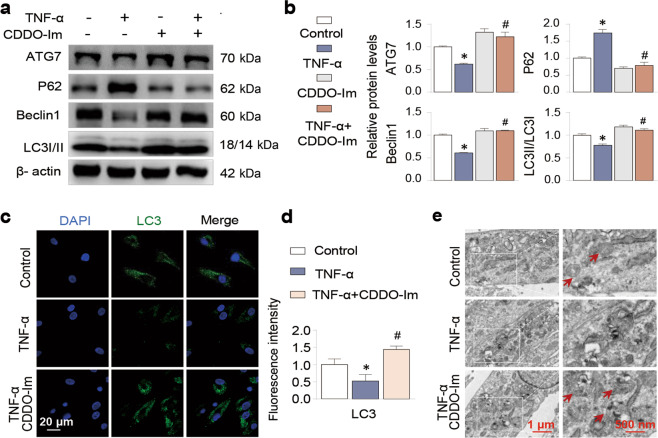
Fig. 3. CDDO-Im enhances autophagy in TNF-α-treated chondrocytes.
a, b Western blot analysis of protein expression and quantification of ATG7, P62, Beclin1 and LC3 I/II in chondrocytes treated with control vehicle, CDDO-Im (20 nM), TNF-α (50 ng/mL) or CDDO-Im plus TNF-α for 24 h. The relative levels of LC3 are expressed as the ratio of LC3II/LC3I. c Representative images of Immunofluorescence-stained LC3 in chondrocytes treated with CDDO-Im (20 nM) with or without TNF-α (50 ng/mL) for 6 h. d Quantitative analysis of the data in Fig. 3c. e Representative TEM images of chondrocytes treated with CDDO-Im (20 nM) with or without TNF-α (50 ng/mL) for 6 h. The arrows point to autophagic vesicles. The values are presented as the means ± SDs. *P < 0.05 versus control, #P < 0.05 versus TNF-α-treated chondrocytes.

