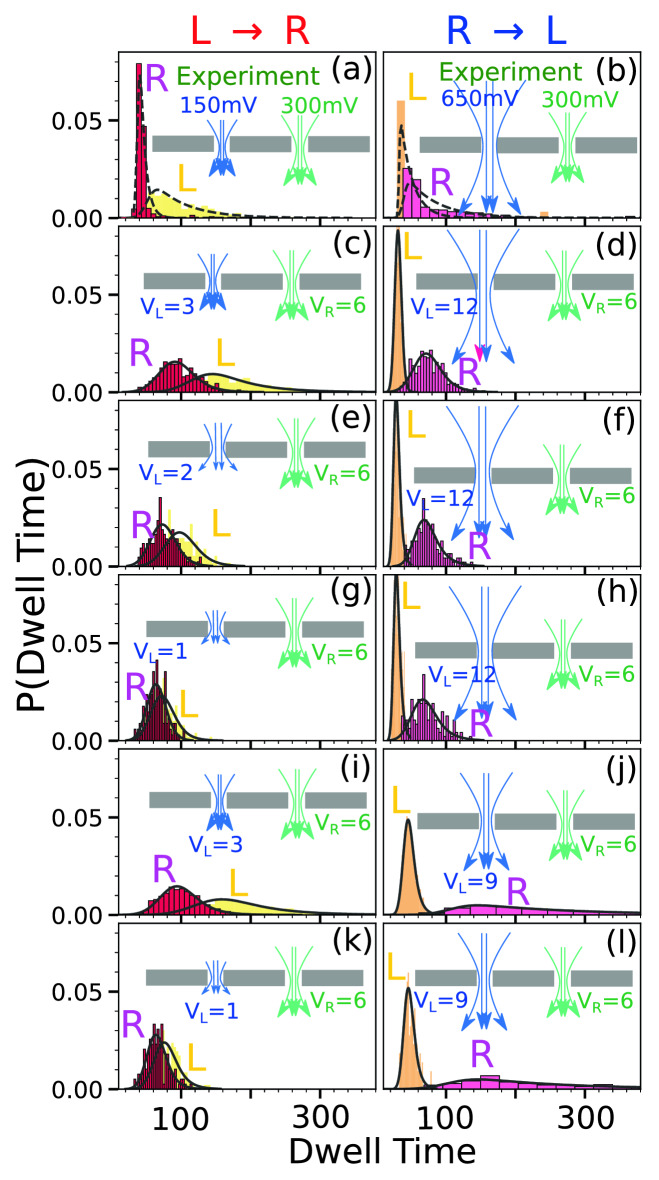
Figure 3.
Cumulative dwell time distribution of the seven tags (sidechains) obtained from the experiment for (a) and (b) scans (1st row). The rest of the rows ((c)–(d)–(k)–(l)) (2nd–6th) are simulation dwell time data for the different combinations of voltages and applied across the left and the right pore for the seven sidechains placed exactly at the same locations as that of the experiment. Please note that each row consists of one flossing (two scans from and respectively with two distributions at left/right pores for each scan direction). In each row the yellow/red (left column) and the orange/magenta (right column) dwell time histograms are obtained from the left/right pore in and directions. Schematics of the electrostatic forces on the DNA in the left/right pore are shown by the blue/green arrows (not to scale). The black envelops represent the exponentially modified Gaussian distribution fit of the dwell time histograms.

