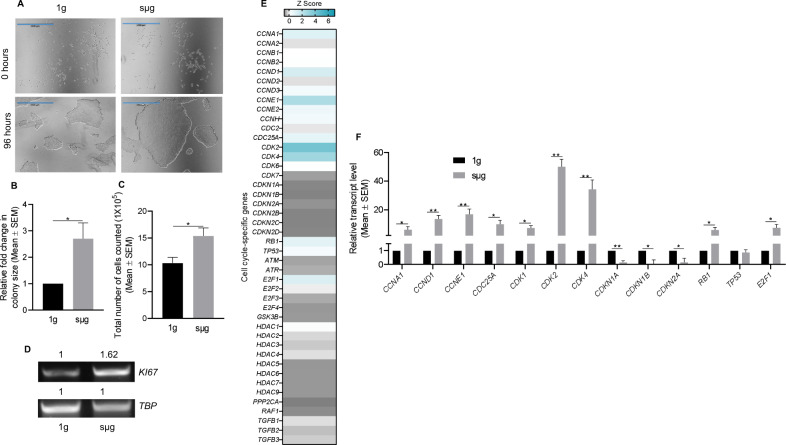
Fig. 4. Simulated microgravity (sµg) enhances the proliferation of hPSCs.
A Representative micrographs of hPSC colonies cultured under sμg and 1g conditions. Scale bars, 1000 µm. B Graphs indicating significant fold change difference in hPSC colonies area after 96 h of culture under smg and 1g conditions. C Graph comparing the total cell number of hPSCs after 96 h of culture under sμg and 1g conditions. D Representative gel band images of rt-PCR analysis for the cell proliferation gene Ki67 in hPSCs after 96 h of culture under sμg and 1g conditions. The mRNA expression of TBP was used to show equal loading and to quantify the relative differences in expression, as indicated above each band. E Heat map showing the relative mRNA levels of 44 human cell cycle-associated genes in hPSCs culture under sμg for 96 h in relation to cells cultured in 1g condition. F RT-qPCR analysis was used to verify the expression of selected genes tested in the gene array assay. *p < 0.05, **p < 0.005 (n = 3; unpaired t test). Error bars in graphs represent the SEM of the group.

