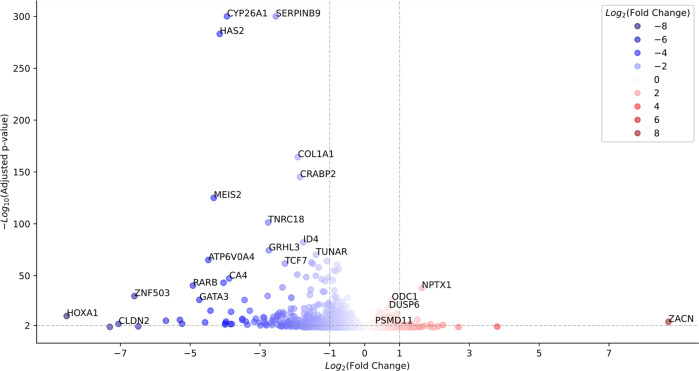
Fig. 5. Volcano plot of differential gene expression between hPSCs cultured in simulated microgravity (sµg) and 1g condition.
The color intensity is proportional to Log2 (Fold Change). Genes are overly expressed under sµg condition if Log2 (Fold Change) > 0 (colored red in the figure). The vertical dashed lines correspond to Log2 (Fold Change) = ±1, and the horizontal line corresponds to the adjusted p-value = 0.01. There are a few genes that are highly expressed under 1g conditions such as HAS2, CYP26A1, SERPINB9, etc.

