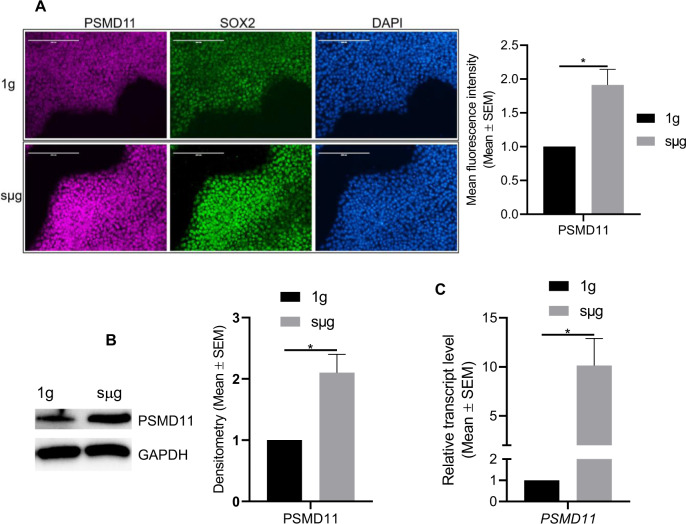
Fig. 6. Simulated microgravity (sµg) enhances PSMD11 expression in hPSCs.
A Representative immunofluorescent micrographs of hPSCs cultured in sμg and 1g conditions and stained for PSMD11 and SOX2. DAPI was used to stain the nuclei of all cells. Scale bars, 200 µm. Graphs showing the mean fluorescence intensity analysis from micrographs. B Representative Immunoblots and densitometry analysis of PSMD11 from protein lysates of cells cultured at sμg and 1g conditions. GAPDH was used as a loading control. Graphs on the right show the densitometry analysis of the immunoblots. C RT-qPCR analysis indicating the relative mRNA levels of PSMD11 present in cells cultured at sμg compared to 1g condition. *p < 0.05 (n = 3; unpaired t test). Error bars in graphs represent the SEM of the group.

